Download
1 / 50
500 likes | 630 Vues
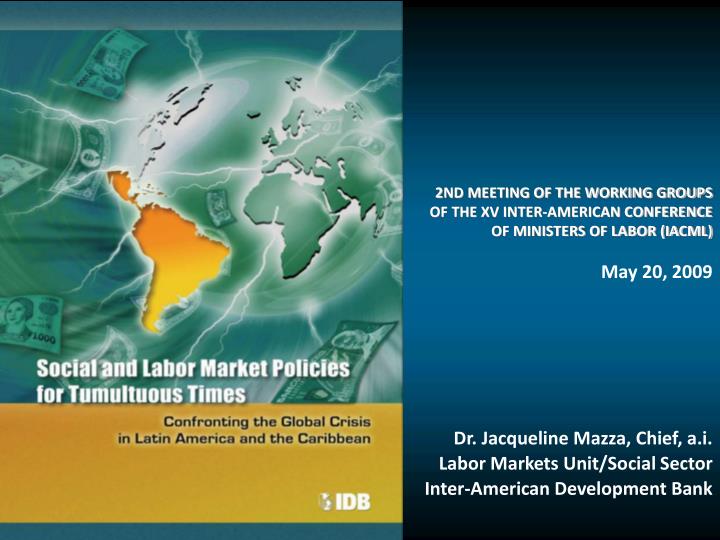
2ND MEETING OF THE WORKING GROUPS OF THE XV INTER-AMERICAN CONFERENCE OF MINISTERS OF LABOR (IACML) May 20, 2009. Dr. Jacqueline Mazza, Chief, a.i. Labor Markets Unit/Social Sector Inter-American Development Bank. Outline. 1. The global macroeconomic crisis in phases

E N D
2ND MEETING OF THE WORKING GROUPS OF THE XV INTER-AMERICAN CONFERENCE OF MINISTERS OF LABOR (IACML) May 20, 2009 Dr. Jacqueline Mazza, Chief, a.i. Labor Markets Unit/Social Sector Inter-American Development Bank
Outline 1. The global macroeconomic crisis in phases 2. Main transmission channels to LAC 3. Trends for 2009 and 2010 4. Labor Market Policy Responses
Global macroeconomic crisis: Phase 1 - Phase 2 - Phase 3 (?)
Development of the global financial crisis in phases Crisis Grips Mortgage Finance GSEs 4.56% Phase 1: Interbank Interest Rate • A panic-driven US financial crisis. • Belief that growth would decelerate, but recession unclear. (Libor spread over 3-month T-bill, %) Phase 1 Phase2 5.0 JPMorgan Acquires Bear Stearns Phase 2 : • Major capital losses in the financial system. • High unemployment in industrialized and some developing countries, decreasing demand for developing country goods • Developing countries growth rate would decelerate, but some could escape recession Beginning del Banking Problems 4.5 4.0 3.5 3.0 Average: 1.33% 2.5 2.0 1.5 Average: 0.38% 1.0 0.5 0.49% Phase 3: (?) • Longer world recession; scarcity of credit, potential for protectionism • Large sectoral unemployment in key countries • Slow to no employment growth, duration unclear 0.0 Jul-08 Jul-07 Oct-07 Apr-08 Jan-09 Apr-07 Nov-08 Jan-07 Jun-07 Jan-08 Jun-08 Mar-07 Mar-08 Aug-08 Oct-08 Feb-09 May-07 Aug-07 Nov-07 May-08 Feb-07 Feb-08 Sep-08 Sep-07 Dec-08 Dec-07 Source: Based on Bloomberg.
2. Transmission channels to LAC: How are regional labor markets affected? • Financial markets • World growth • Commodity prices and trade
250 235 220 205 190 175 184 160 145 130 115 100 Oct-07 Jul-07 Jul-08 Oct-08 Jun-08 Jun-07 Jan-08 Nov-07 Jan-07 Apr-08 Apr-07 Mar-08 Mar-07 Aug-07 May-08 Aug-08 May-07 Sep-08 Feb-08 Feb-07 Sep-07 Dec-07 External factors: Investment Capital Falling to LAC Capital Inflows* (LAC-7; last 12 months, billions of US dollars of 2007) Phase 2 Phase 1 241 *Own estimates based on official capital inflows, trade balance and international reserves.
World growth rates declining 3.0% 2.10% 2.0% 1.50% 1.10% 1.0% 0.0% -1.0% -2.0% -3.0% -3.20% -4.0% 2.0% 1.40% 1.20% 0.70% 1.0% 0.0% -1.0% 2.5% 1.80% -2.0% 1.30% 1.5% -3.0% 0.70% -4.0% 0.5% 9.60% 10.0% 9.00% 9.00% -5.0% 9.0% -0.5% 8.0% 7.60% -6.0% 8.0% 7.10% -6.40% -1.5% 7.0% -7.0% 7.0% 6.00% 6.50% 6.0% 6.0% -2.5% 5.00% 5.0% 5.0% -3.5% -3.30% 4.0% 4.0% 3.0% 3.0% 2.0% 2.0% 1.0% 1.0% 0.0% 0.0% (Real GDP growth, yoy) US 2008 2009 (Light) (Darker) Forecasts in May-08 May-09e Forecasts in May-09 May-08e May-09e May-08e Japan EU-15 2008 2009 2008 2009 China 2008 2009 India 2008 2009 Source:EIU.
External factors: commodity prices falling, hits key LAC countries 750 340 190 310 650 170 280 550 250 150 450 220 130 190 350 110 160 250 130 90 150 100 70 70 50 2003 2002 2005 2008 2001 2004 2006 2007 2001 2002 2003 2004 2005 2006 2007 2008 2001 2002 2003 2004 2005 2006 2007 2008 Metals Oil Food (1991-1997 Average = 100) (1991-1997 Average = 100) (1991-1997 Average = 100) US Financial Crisis US Financial Crisis US Financial Crisis 725 313 177 Change Dec.01 – Jul.08: +616% Change Dec.01 – Jun.08: +133% Change Dec.01 – Mar.08: +282% 373 -46% -30% 123 123 -68% 158 91-97 Average 228 91-97 Average 91-97 Average
Worsening of credit conditions for LAC Sovereign and Corporate Bonds Yields & Spreads Source: Bloomberg.
FACTORES EXTERNOS International Financial Conditions Growth in industrialized countries Commodity prices Sovereign Bond Spread Global Commodity Price Index Industrial Production: G7 (2006 = 100) (2006 = 100) (EMBI +, bps) 700 L-Shaped L-Shaped L-Shaped V-Shaped V-Shaped 135 109 Peak Mar-08 Trough Jun-09 P-to-T -4.3% Recovery* Sep-10 Jun-07 Jun-09 512 . Dec-13 Jun-08 Jun-09 -47.3% Dec-13 Mar-08 Jun-09 -4.3% Dec-13 L-Shaped Scenario Peak Jun-08 Trough Jun-09 P-to-T -47.3% Recovery* Sep-10 V-Shaped Scenario 600 125 107 V-Shaped Scenario 500 115 105 V-Shaped Scenario 400 Pre- Asian Crisis Levels 105 103 Pre-Crisis Levels Pre-Crisis Levels 300 95 101 V-Shaped Trough Jun-07 Peak Jun-09 T-to-P 512 Recovery * Sep-10 L-Shaped Scenario 200 85 99 L-Shaped Scenario 75 97 100 2006 2007 2008 2009 2010 2011 2012 2013 2006 2007 2008 2009 2010 2011 2012 2013 2006 2007 2008 2009 2010 2011 2012 2013 Source: IMF and Bloomberg* Source: JPMorgan for Bond Spreads Source: Own calculations based on WEO and JPMorgan*, Oct-08. *Recovery to Dec-06 levels. *Recovery to pre-Asian Crisis levels G7 is the weighted average, adjusted for PPP, for Canada, France, Germany, Italy, Japan, United States and the United Kingdom. *Recovery to pre-crisis production levels. Hypotheses of the global economy
Latin America and the Caribbean Trade Forecast Source: World Bank, Global Economic Prospects 2009 d: Exports and imports of goods and nonfactor services; e: estimated; f: forecast
LAC regions will be affected in different ways through financial, growth and commodities channels: Caribbean: lower oil prices (positive), lower remittances and weak tourism. Mexico and Central America: Strong commercial ties with the US. Heavily dependent on remittances from the US. Benefit from oil shock (except Mexico). Andean region: lower energy and commodity prices; higher financial costs, lower exports. Southern cone: commodity exporters, affected by world demand slowdown, tight financial conditions.
3. Implications for LAC in 2009 – 10: Phase III • Growth • Employment • Remittances • Poverty and social risks
Estimations / Forecasts* 03-06 Growth Average: 5.6% May-08 5.1% Jan-09 5.0% May-08 4.4% 91-97 Growth Average : 4.6% Jan-09 1.5% 98-02 Growth Average : 0.7% Jan-09 Revisions* Growth – 2009 slowdown forecast (LAC-7; real GDP, annual variation) Beginning of the Current Boom Russian Crisis 7% 6% 5% 4% Average 71-06: 3.4% 3% 2% 1% 0% -1% US Financial Crisis -2% 1991 1992 1993 1995 1994 1996 1997 1998 1999 2000 2001 2002 2003 2004 2005 2006 2007 2008E 2009F LAC-7 is the simple average of the seven major Latin American countries. *Source: JPMorgan
Growth projections in 2009 Gross Domestic Product (annual change in %). 2009 Source: Latin Focus Consensus Forecast
Economic activity in LAC according to two hypotheses of the global economy Economic Activity GDP Growth (LAC-7 PIB, 2006 = 100) (LAC-7, annual change) 7% 125 V-Shaped L-Shaped Peak Dec-08 Dec-08 Trough Sep-09 Dec-10 P-to-T -3.9% -5.1% Recovery* Mar-11 Dec-13 2003-2007 Avg.: 5.8% 6% 120 5% V-Shaped Scenario 4% 1991-2007 Avg.: 3.3% 115 Pre-Crisis Levels 3% V-Shaped 2009-13 Avg.: 1.9% 2% 110 1% L-Shaped Scenario L-Shaped 2009-13 Avg.: 0.1% 105 0% V-Shaped Scenario -1% 100 L-Shaped Scenario -2% -3% 95 2006 2007 2008 2009 2010 2011 2012 2013 2006 2007 2008 2009 2010 2011 2012 2013 *Recovery to pre-crisis levels
Employment Some Effects: • Reduced demand + reduced credit = greater firm failures, particularly SMEs. • Absence of sharp increases in inflation avoids lower real wages; this cushions impact on those holding jobs, but implies larger employment effects. • Layoffs/job loss resulting in increases in open unemployment (not mitigated by unemployment insurance) • Higher informal employment. • Reduced opportunities leading to discouraged workers dropping out of labor force. Scope for impact: Labor income comprises 80% of household income in LAC.
Projected Unemployment Rates(annual change in %, forecasts in April and May of 2009) 20.0 18.0 16.0 14.0 12.0 2009, 2004-07 2008, 9.0 10.0 2004-07 2009, 8.1 2009, 8.0 2008, 6.8 6.5 5.6 2008, 6.0 2004-07 3.9 4.0 2.0 0.0 Mexico Panama Peru 20.0 20.0 18.0 18.0 16.0 16.0 2009, 14.8 14.0 14.0 2008, 2009, 12.6 2004-07 12.0 11.3 12.0 2004-07 2004-07 2009, 2004-07 2009,9.7 10.0 9.3 10.0 2008, 2008, 2008, 2009, 8.5 2008, 7.9 7.88 2004-07 7.7 7.50 8.0 2009, 8.0 2004-07 2008, 5.8 6.0 4.9 6.0 4.0 4.0 2.0 2.0 0.0 0.0 Chile Colombia Costa Rica Argentina Bolivia Brazil 2009, Source: EIU, based on official data 20.0 18.7 2004-07 18.0 2008, 2009, 15.5 16.0 14.5 14.0 2008, 12.0 11.0 2004-07 10.0 2009, 2008, 8.0 6.8 2004-07 6.3 6.0 4.0 2.0 0.0 Dominican Republic El Salvador Jamaica Informal employment not captured by these figures.
Latin American unemployment expected to grow to at least 14 million people in 2009 for the 12 largest countries
Latin American unemployed expected to exceed US unemployed Sources: US projection –IDB calculations using projections from Federal Reserve of the United States (13 million); Latin America projection from International Labor Organization (17 million).
More than half of U.S. unemployed will be covered by unemployment insurance, with benefits recently extended… Source: IDB calculations using projections from Federal Reserve, data from Bureau of Labor Statistics, 56% of unemployed covered by UI program
Most Latin American countries do not have UI, the few that do have low coverage…
Gender and Unemployment Dimension: United States In the US, 82% of those laid off have been male
But the situation in LAC appears to be different: • LAC may experience the largest impact in terms of unemployment among women. This is because of the sharp slowdown in growth, concentration in key sectors, and the disadvantaged position of women in labor markets in the region • Unemployment among women in the region could reach 9.8% to 11% in 2009, which represents 11 to 13 million women (ILO). Source: Global Employment Trends for Women 2009. ILO
Women in LAC are more affected by unemployment Source: Global Employment Trends for Women 2009. ILO
Gender and the financial crisis in the region: • Mexico • According to 2008 data from INEGI, 71% of all layoffs were of women, representing 1,364,000 women who lost their jobs. • Nicaragua • In the maquila sector, mostly dedicated to garment and accessories production, 19,000 people were laid off; this represents a 21% drop in jobs in the free trade zones relative to the beginning of 2009. • Honduras • Female employment is highly concentrated in the textile manufacturing industry and maquilas in general, formal commerce, financial services, tourism, and restaurants. • Through mid-February 2009, the maquila sector reported a loss of 29,000 jobs, of which 70% belonged to women.
Remittances: A slowdown in 2008 will become a decrease in 2009 • After years of double-digit growth rates, remittances to the region increased just 0.9% between 2007 and 2008. • Remittances are projected to decrease in 2009, the first downturn since the IDB started tracking flows in 2000 Source: Multilateral Investment Fund
Remittances to the region, 2008 Source: Multilateral Investment Fund
How will the remittance slowdown affect the region? • Diverse impact expected by country/region • Exchange rates key: • Remittance values in local currencies up in Mexico, Brazil and Colombia because of dollar • Central America and Ecuador – dollarized or largely pegged to dollar, 4% decline in values in Central America • Southern Cone & Ecuador – remittances in falling Euro, Ecuador 22% decline in value of remittances.
Poverty: Slowdown in decreasing trend of poverty rates in LAC and possible reversals during 2009 60.0 % 50.0 40.0 25.8 24.6 24.5 25.3 30.0 21.9 24.4 23.0 21.5 20.3 20.0 22.5 10.0 19.4 19 18.6 18.5 15.4 13.3 12.9 12.6 0.0 1980 1990 1997 1999 2002 2005 2006 2007 2008 Extreme poverty Moderate poverty % Source: ECLAC, 2008.
Poverty Effects: • Wage declines and job loss cause poverty deepening for the chronically poor • Labor market adjustment creates new poor (transitory) • Declines in remittances • Declines in consumption • Higher chronic malnutrition Scope for impact: • Substantial risk of higher poverty levels and decreases in consumption. • Substantial risk for irreversible health and productivity effects among chronically poor.
The Policy Context for this Crisis • High levels of uncertainty regarding: • Growth rates • Duration/nature of crisis • Fiscal space • Policy responses adapted to very different LAC circumstances
A framework for labor policies a) Short-term measures Programs or policies to mitigate the largest and most immediate impacts of the crisis (e.g., unemployment) and/or protect income or social conditions b) Systematic measures Structural reforms that transform the basic nature of policies, and which are necessary to ensure that the country emerges from the crisis in a competitive position
Labor Policy: Two Levels Operating Simultaneously Level 1: Mitigating the worst short-term effects of the crisis • Large scale unemployment • Particularly when concentrated (regionally) with potential ripple effects on local demand, consumer spending • Affects vulnerable groups with poorer reemployment prospects • Danger of losing formal jobs
Labor Policy: Two Levels Operating Simultaneously Level 2: Advancing systematic (medium-term) policies to emerge from crisis in better competitive position Labor markets with better functioning in: • Effective allocation and re-allocation of workers in jobs • Productivity with complementary SME policies • Improvement in the quality of employment
Level 2: Systematic policy measures needed because, on average, Latin America and the Caribbean have not made the systematic labor market reforms or put in place labor market “stabilizing” policies that other regions have • Post-crisis: LAC could be in a less competitive position relative to other regions that are developing proactive policies
Country-Level Considerations: Short-Term Policies • Dimension/duration of short-term impacts • Existing Institutional Capacity • Best case: modification of existing labor market programs • Ability to rely on social programs for the most important social impacts • Who is most affected: • formal employment – “new poor” not eligible for CCTs • poor, informal workers – potential poverty crisis • women, excluded groups • Make sure temporary policies really temporary • Avoid perverse effects that increase informality, decrease productivity
Short-Term Policy Measures Short-term measures to retain or absorb workers in jobs… • On-the-job training (OJT) • Used to both retain workers and employ the unemployed • Good re-employment and retention record with short-term training, if done in the workplace and related to improving skills for a specific job • Examples: BECATE, Mexico
Short-Term Policy Measures • Adapting Youth Training Models • Mix of OJT with classroom-based skills training • Successful at getting at-risk youth into new employment • Utility in crisis? … Dependent on firms’ potential to hire new employees • Examples: Juventud y Empleo (Dominican Republic); Procajoven (Panama)
Short-Term Policy Measures • Temporary Employment • Target: very poor, largely informal workforce • Designed to keep very poor, unemployed workers earning a basic income in their home region • Emphasis on labor-intensive projects • PET (Mexico), Programa de Empleo Mínimo (Chile), Construyendo Peru
Short-Term Policy Measures • Temporary Employment: Key Lessons • Fix salary levels below minimum wage • Wage costs should comprise the large majority of total program costs • Rapid execution is key – utilize existing institutional frameworks
Short-Term Policy Measures • Public Works • Alternative to temporary employment, with higher value on public work, less employment impact • Range of salary levels, not just poor • Can be tied to needed social investments
Short-Term Policy Measures • Extend workers’ benefits/contract adjustments • May consider extensions of short-term health benefits, social security payments, catastrophic medical coverage • Include short work furloughs, unpaid vacations, part-time employment, job sharing • Can be initiated by firms without government subsidy or support, union-firm accords • Issues: fiscal implications, targeting and eligibility challenges, temporariness, incentives to informality
Systematic Policy Measures Two principal objectives of systematic policy measures: Increase the competitiveness of firms Support and better allocate human capital
Systematic Policy Measures Measures to increase firm competitiveness • On the job training and human resource restructuring for greater productivity • Economic restructuring (e.g. products, new markets, new lines of production) • Changes in human resource organization (internal processes, job organization)
Systematic Policy MeasuresMeasures to support and better allocate human capital • Improving human capital formation through technical education reform • Key for LAC: reforms in technical education • Better links to/management of private sector • Role of community colleges • Strengthen teachers’ capacities
Systematic Policy MeasuresMeasures to support and better allocate human capital • Restructuring labor benefit system to alleviate future crises • Severance pay • Unemployment insurance • Pension systems
Systematic Policy MeasuresMeasures to support and better allocate human capital • Building the infrastructure to help workers get jobs • Reforms and improvements to labor intermediation systems, including: • Links to the private sector • Improvement in the quality of jobs and the quality of job placement services • Attention to special needs groups in the labor market