Download
1 / 22
220 likes | 333 Vues
GPU Stock Simulator. Dan Iannuzzi Kevin Pine CS 680. Outline. The Problem Recap of CS676 project Goal of this GPU Research Approach Parallelization attempts Results Difficulties Encountered Lessons Learned Future Work Opportunities Conclusion. The Problem.

E N D
GPU Stock Simulator Dan Iannuzzi Kevin Pine CS 680
Outline • The Problem • Recap of CS676 project • Goal of this GPU Research • Approach • Parallelization attempts • Results • Difficulties Encountered • Lessons Learned • Future Work Opportunities • Conclusion
The Problem • Every day millions of trades are recorded per stock • Traders want to test a given strategy of trading on some combination of stock indicators • We must get a hold of all this stock data per stock • Run all desired stock analysis • Simulate buy/sell actions based on analysis • Display results
Recap of CS676 Project • Stock data stored in many csv files (each stock having many data points each) • Read and store stock data • Loop on each stock • Run calculations on 3 chosen stock market analysis indicators • Keep track of the buy/sell signals for each indicator • Buy/sell stock as appropriate, tracking if sell is gain or loss • Print out number of trades, number of gains, number of losses, average gain, and average loss
Parallelization Done in CS676 • Two main types of parallelization performed: • File I/O parallelization done using OpenMP loop • Parallelization of the calculation of the 3 indicators done for each stock done using OpenMP • Stock data stored in map from stock name to list of data • Move private map iterator forward by number of threads • Process full list of stock data for each iterator • Further performance refinements made to optimize based on initial results that were observed • Results • Focus was on parallelizing the simulation • Reached a sim speedup of about 9 • Efficiency was above .9 until 10 threads for sim Time
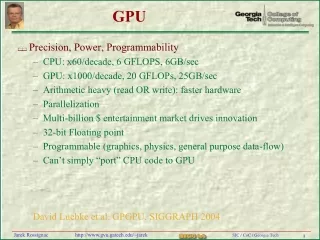
Goals of This Research • Analyze CUDA implementation to determine the speedup over a sequential C implementation • Analyze different types of CUDA programming strategies • Work split across multiple GPUs • Using different types of GPU memory (i.e.: pinned vs. shared vs. constant) • Time various aspects of the implementation • Copy time to and from the device (found most of our time spent here) • Computation time needed for the buy/sell simulation
Approach • Convert C++ implementation to C • Simplified data read by condensing data into 1 file • Replaced C++ standards with C standards (ie: STL maps to C structs) • Compile using nvcc compiler and verify functionality matches C++ version by comparing outputs on same data set • Convert CPU methods to device methods • Launch a thread per set of stock data points • Each thread responsible for fully processing all indicators for the one of the stock’s data points • Experiment with different implementations and approaches to parallelize the computations on the GPU using various CUDA mechanisms
Parallelization Attempts • Each thread handles set of stock data elements from original data set and we do the 3 technical indicator calculations in parallel • Achieved approx. 2.2 speedup • Concluded we spent too much time copying memory • Attempted to use zero-pinned memory to remove copying costs • We saw really poor performance and concluded that we simply had too many reads and had too much of a penalty per read • We also believe that with an integrated GPU this would have been much more successful
Attempts Con’d • Attempted to increase the data set size, but hit memory limitations on GPU so tried blocking the GPU calls • Allowed us to increase the data to 8, 16, and 32 times the original data set • Saw only 2.4 speedup and concluded we simply did not have enough computation per data point and was spending all our time copying memory • Reduce the size of our data structure that was being copied • This led to much less of a performance hit due to the memory copying and we saw speedup around 3.55 • We felt without reworking the structure of the program we were losing data and thus abandoned this approach, but it did show how strong the memory copying penalty was
More Attempts • Use two GPUs, which in theory should decrease the time spent copying the data since done in parallel • This with the original data set yielded slightly better results over 1 GPU • Again concluded our problem was not enough computation per data point transferred to GPU • Increased the computation per data point by using 2 of 3 indicators x number of times • Combined with multiple GPUs and this is the ending project result, which will be discussed in a minute
Partial Attempts • Shared Memory • Attempted to put stock data into shared memory that all threads in a block would need • Realized what we were doing really didn’t make since for shared memory (no relation between each threads work) • Use constant memory for stock data since only need read op • Constant memory is only 64K and each stock data struct is 112 bytes and thus we can only fit 585 stock data pts in constant memory at a time. This would require lots of blocking (over 6 million data pts in our data set and easily can be in the billions!) • Tests on a small dataset showed no increase in performance, but perhaps the data set was being cached in the sequential, no further work done
Experimental Machine • Conducted timings on float.cs.drexel.edu • Float has 8 cores at 2.13 GHz, 12M cache, 28GB Ram • Float has 2 GeForce GTX 580 cards, each which has max of 1024 threads per block and 65535 blocks per grid • Testing was done by manual comparison of answers to known correct sequential program from CS676 • All graphed numbers were generated by taking 3 samples. The other numbers mentioned were not created through a formal timing process • We used 1024 blocks and 128 threads for all tests as it seemed to yield the best results in spot testing • Implementation benchmarked is 1 and 2 GPUs varying the number of indicators calculated
We were unable to calculate the computations/second due to the large number of things going on with the various indicators, etc. Here is runtimes for your general reference.
Memory Copying Analysis • StockDatastruct size = 112 bytes • ResultDatastruct size = 24 bytes • Size of int = 4 bytes • Num Stocks: 2797 • Num data pts: 7840207 • Stock Data size: 878103184 bytes (837 MB approx.) • Result Data size: 188164968 bytes (179 MB approx.) • Min Index size: 11188 bytes (11KB approx.) • Total Memory: 1066279340 bytes (1 GB approx.) • This was split over 2 devices, so a total of about 500MB per device is being copied
Computeprof Results • For 100x indicators, we got 3.51% time spent on memory copying • For 1x indicator, we got 64.2% time spent on memory copying • These results match our expectations, that without enough computation, the memory copying penalty is too steep to see much performance gain • We also conclude with a large number of indicators streams will not be helpful, but with a smaller number we can make use of them and use many GPUs to increase overall performance
Difficulties Encountered • Difficult to convert a C++ program to a C program • Most difficult part was all the manual memory handling needed for our C structs over the STL • Lots of options when trying to parallelize using CUDA
Lessons Learned • CUDA is very application specific • Lots of different tradeoffs needed to find best approach to parallelization on GPU • Number of blocks and number of threads per block • Using multiple streams vs. single stream • Determining the best way to implement across multiple devices • Need to invest time to understand the tools available to a developer using CUDA • Debugger • Profiler (computeprof)
Future Work Opportunities • Implement more complex indicators • Implement indicators where computations may be able to be split over the threads, instead of having a thread do all the computations for each stock data point. In this scenario shared memory becomes much more useful! • Use multiple streams to avoid long upfront delays copying stock data • Implement on an integrated GPU to avoid the penalty of copying across the PCI express
Conclusions • In scenarios where there is a large amount of data that the GPU will need, you need more GPUs • 4.2 to 8.4 by using 2 GPUs at 2001 indicators • Need enough computation to offset copying to GPU • This application is much more data intensive than computation intensive per data point, which may not be a perfect fit for the GPU without considerable redesign of the problem (or doing different more complex indicators) • Speedup not as great as we had hoped • Lots of opportunities to make this research better • Learned a lot about CUDA in a short amount of time
Technical Indicators Used • Moving Average Convergence/Divergence (MACD) • Measures momentum of a stock • Calculated by looking at the difference between two exponential moving averages over the last n days • Shorter exponential moving average of MACD value used as signal • Movement of MACD compared to signal indicates start and stop of trends • Relative Strength Index • Momentum oscillator indicating velocity and magnitude of price movement • Measured from 0 to 100 • Above 70 suggests overbought, below 30 suggests oversold • Stochastic Oscillator • Momentum indicator comparing closing price to price over a period of time • Ranges from 0 to 100 • Above 80 suggests overbought, below 20 suggests oversold