Download
1 / 18
180 likes | 244 Vues
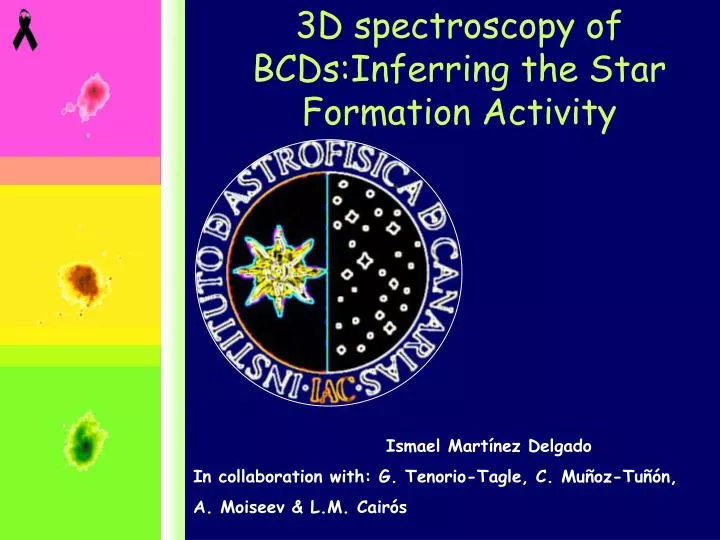
3D spectroscopy of B CDs:Inferring the Star Formation Activity. Ismael Martínez Delgado In collaboration with: G. Tenorio-Tagle, C. Muñoz-Tuñón, A. Moiseev & L.M. Cairós. “3D Spectroscoy: The SIL Diagrams”. Granada, 2 March 2007. “3D Spectroscoy: The SIL Diagrams”. Observations.

E N D
3D spectroscopy of BCDs:Inferring the Star Formation Activity Ismael Martínez Delgado In collaboration with: G. Tenorio-Tagle, C. Muñoz-Tuñón, A. Moiseev & L.M. Cairós
“3D Spectroscoy: The SIL Diagrams” Granada, 2 March 2007
“3D Spectroscoy: The SIL Diagrams” Observations Granada, 2 March 2007
“3D Spectroscoy: The SIL Diagrams” Metodology Single gaussian fit profile to the emission lines. Ipeak (a.u.) σ (km s-1) λc (Å) Mrk 600 Granada, 2 March 2007
“3D Spectroscoy: The SIL Diagrams” • Previous Work: • Shells, Filements, Bubbles • Nuclear regions NGC604 Muñoz-Tunón et al 1996 Granada, 2 March 2007
“3D Spectroscoy: The SIL Diagrams” • The Sigma-Intensity-Lambda (SIL) diagrams: • I. Martínez-Delgado et al, AJ, June 2007 NGC604 Muñoz-Tunón et al 1996 Granada, 2 March 2007
y (“) x (“)
σ=33.2 km s-1 y (“) x (“) σ=33.0 km s-1 I. Martínez-Delgado, submitted to AJ (105-106 M ๏)
σ=57.4 km s-1 y (“) x (“) σ=61.7 km s-1
σ=19.3 km s-1 y (“) I. Martínez-Delgado et al, submitted to AJ (~104 M๏) x (“) σ=7.3 km s-1
σ=63.4 km s-1 σ=57.2 km s-1 I. Martínez-Delgado, submitted to AJ (105-106 M ๏)
σ=31,0 km s-1 σ=45.4 km s-1
σ=70.9 km s-1 σ=86.7 km s-1
Galaxy - Galaxy Collision • Alloin & Duflot (1979)is a colliding system between two disk galaxies, one in the NW and the other in the SE • Taniguchi et al (1991)A co-planar radial penetration collision between two disk galaxies
“3D Spectroscoy: The SIL Diagrams” Summary and conclusions Granada, 2 March 2007 THE SIL DIAGRAMS • The σ vs Ipeak is an excellent diagram to separate the main broadening mechanism affecting the emission lines that lead to shells, loops by the violent action of the massive stars. • The σ horizontal band, for the case of multiple massive nuclear burst of SF, has been shown to split in different bands in the λc vs Ipeak. • Theσ vs λc diagram picks up the small burst of stellar formation by tracing their lower intensity and slower expansion of their immediate surroundings. • In the case of III Zw 102 the stalactites correspond to the outer ionized regions and their spred in σis the result of their expansion in a lower density medium.. • In the case of Mrk 297 the displacement among the emission lines between two areas of the galaxy are consistent with previous works for a collition event. • On the whole, the SIL diagrams, provide the posibility of inferring the SF activity in distant galaxies even if these are not spacially resolved by means of 3D spectroscopy.
3D spectroscopy of BCDs:Inferring the Star Formation Activity Ismael Martínez Delgado In collaboration with: G. Tenorio-Tagle, C. Muñoz-Tuñón, A. Moiseev & L.M. Cairós