Download
1 / 10
100 likes | 252 Vues
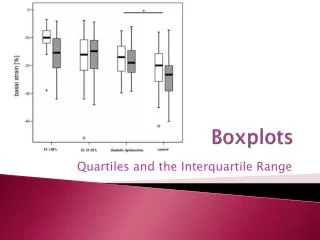
Boxplots. Boxplots & the 5 # Summary. To construct a boxplot, first obtain the 5 number summary { Min , Q 1 , M , Q 3 , Max } Q 1 : 1 st quartile = 25 th percentile M = Q 2 : median = 2 nd quartile = 50 th percentile

E N D
Boxplots & the 5 # Summary To construct a boxplot, first obtain the 5 number summary { Min, Q1, M, Q3, Max } Q1: 1st quartile = 25th percentile M = Q2: median = 2nd quartile = 50th percentile Q3: 3rd quartile = 75th percentile
Example: Simple Boxplot Failure times of industrial machines (in hours) 189.1 193.2 200.4 202.6 202.7 206.7 211.4 211.6 212.1 215.7 216.6 218.7 219.3 228.5 236.1 236.5 237.0 239.7 244.3 251.5 253.3 257.0 259.9 265.2 267.4 287.7 308.0 329.0 5 # summary: { 189.1 , 211.55, 232.3 , 254.20, 329.0 }
Example: Simple Boxplot Min M Max Q1 Q3
Example: Modified Boxplot A mathematical rule designates “outliers.” These are plotted using special symbols. (Note: The maximum is still 329.0.)
Modified Boxplot: Outliers A mathematical rule designates “outliers.” Outliers are part of the data – do not assume they are “bad data” or can be deleted. In fact, they may constitute the most meaningful information in the data. If we discover why the one machine took so long to fail, perhaps we can adjust others to increase the likelihood of a large failure time for future machines. Then future failure times should be plotted in a new boxplot.
Modified Boxplot: Outliers A mathematical rule designates “outliers” in a boxplot. Sometimes* an outlier is ripe for… …change learn why it’s wrong and correct it …deletion on the basis of something that distinguishes the unit (but not the value alone) determine why it’s different and doesn’t belong * not always – in fact, in this class, you may assume that outliers aren’t “wrong” and “do belong.
Modified Boxplot: Outliers A mathematical rule designates “outliers.” For a large set of good data drawn from a Normal population, about 2% of the data will be marked “outlier” in a modified boxplot. For small but good data sets, generally more than 2% will be so marked. For good data from skewed distributions, generally much more than 2% will be so marked.
Modified Boxplot: Outliers Learn to match shape with boxplot orientation.