Download
1 / 28
280 likes | 435 Vues
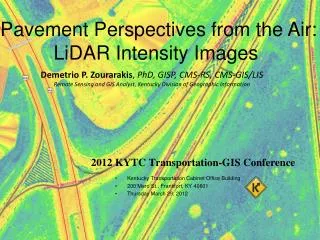
Pavement Perspectives from the Air: LiDAR Intensity Images :. Demetrio P. Zourarakis , PhD, GISP, CMS-RS, CMS-GIS/LIS Remote Sensing and GIS Analyst, Kentucky Division of Geographic Information. 2012 KYTC Transportation-GIS Conference. Kentucky Transportation Cabinet Office Building

E N D
Pavement Perspectives from the Air: LiDAR Intensity Images: Demetrio P. Zourarakis, PhD, GISP, CMS-RS, CMS-GIS/LISRemote Sensing and GIS Analyst, Kentucky Division of Geographic Information 2012 KYTC Transportation-GIS Conference • Kentucky Transportation Cabinet Office Building • 200 Mero St., Frankfort, KY 40601 • Thursday March 29, 2012
Background • Rapidly accumulating LiDAR datasets • LiDAR standards continuously improving – more complex and rich data (LAS 1.4) • A diverse range of products delivered: • Point clouds • TINs • Breaklines • DEMs • Intensity images • Etc., etc., etc.
Background (continued) • LiDAR “point clouds” contain information on surface cover properties: • “top of objects” (structures) • “canopy” (vegetation) • “bare earth” OR “ground” • LiDAR return intensity images and elevation differences are thought of as additional “layers” for image interpretation and classification • Kentucky Aerial Photography and Elevation program • Leaf – off, near infrared aerial orthophotography (yeah!)
LiDAR=ACTIVE remote sensing SOURCE ---------------- RECEPTOR
LAS Binary Data Format (v. 1.2)(Source: ASPRS (http://www.asprs.org) The LAS file is intended to contain LiDAR point data records. The Binary Data Format includes: • Point Data: X, Y, Z, Intensity, Scan Direction Flag, Edge of Flight Line, Classification, etc.
ASPRS Standard LIDAR Point Classes Classification Value 0 Created, never classified 1 Unclassified 2 Ground 3 Low Vegetation 4 Medium Vegetation 5 High Vegetation 6 Building 7 Low Point (noise) 8 Model Key-point (mass point) 9 Water 10 Reserved for ASPRS Definition 11 Reserved for ASPRS Definition • Overlap Points • - 31 Reserved for ASPRS Definition
Viewing, identifying, …accessing, exporting … • Freeware • LAS Reader • LP360 Viewer • Quick Terrain Reader • USFS “Fusion” • Commercial • LP360 • Microstation • ArcGIS Desktop 10.1
Data Types (Esri) ObjectID Text Date Geometry Raster (Long Integer) Short Integer Long Integer Float (Single) Double (Float) Binary Large Object: BLOB = LiDAR DATA
“Intensity Image= can be a complex” • A composite of intensities in 3D space: 1st, 2nd, 3rd, 4th … • FIRST or LAST of multiple returns (classes= unclassified/bare earth) • Hence, multiple ELEVATIONS • A composite of classes (2= Bare Earth; 1=Unclassified) • LAST of MULTIPLE returns (2) • FIRST=LAST if it is ONLY return and NOT a structure (2) Otherwise: • FIRST of MULTIPLE returns (1) • FIRST if a structure (1) • A composite of intensities in 2D space (POINT to SURFACE) • Point to TIN • Point to Raster • TIN to Raster • And what about that pesky quantization issue? • Intensity image delivered to 8-bit (0-255) • .las intensity is delivered by sensor at 12-bit (0-4095) • A few extremely high intensities are filtered out before rescaling
Sample 1 0.5-foot post spacing 1.0-foot post spacing 2.0-foot post spacing
Summary/Conclusions • LiDAR data model different from usual “vector” and “raster • Contains both point and surface (image) information • INTENSITY more variable than ELEVATION - relates to surface properties and condition • Intensity surfaces can be fused with other data – leaf off CIR • 3-D visualization exercises and products
Contact Information Demetrio P. Zourarakis demetrio.zourarakis@ky.gov 502-564-6246 http://gis.ky.gov