Download
1 / 53
550 likes | 771 Vues
Reforms of public finance in Egypt: Energy and Food Subsidies. Price Subsidies in Egypt: Alternatives for Reform Dr. Magda Kandil October 5 th , 2010. Four Dimensions. Subsidies and the state of public finance. Subsidies and social equity.

E N D
Reforms of public finance in Egypt:Energy and Food Subsidies Price Subsidies in Egypt: Alternatives for Reform Dr. Magda Kandil October 5th, 2010
Four Dimensions Subsidies and the state of public finance. Subsidies and social equity. Alternatives to reduce waste of government resources and achieve better equity. Importance of reforms to fiscal space, sustainability and growth.
Presentation Outline The state of public finance in Egypt: Emphasis on subsidies. Petroleum subsidies. Food subsidies. Concluding remarks.
Efforts to mobilize additional revenues have paid off. Yet, there is still room for further improvement
Major reforms of the tax system • In 2005, the introduction of a new income tax law (law no 91 for 2005), replacing law no 157 for 1981. • The new law introduced a number of changes: • The corporate income tax rate ranging 32% - 40% was replaced by a uniform 20% tax rate. (with the exception of the oil and gas sector, where the 40.55% rate continues to apply). • All sector, location and business specific holidays and exemptions were eliminated, • and electronic payment methods were introduced. • The result was a doubling of the number of filed tax returns between 2004 and 2005.
Major reforms of the tax system (Cont’d) • In 2006, the property tax rate was reduced from 47% to 10%, and its scope was expanded. These moves were designed to raise disposable income for consumption and investment while simultaneously broadening the tax base. • In 2008/09, measures to increase tax compliance, the increase in the sales tax on cigarettes and the abolition of some tax exemptions boosted revenues. • In 2008, the introduction of the real estate tax (law no 196 for 2008). • In 2009/10, a new property tax of 10% (which has been postponed to January 2010 from January 2009) should also help lift tax receipts.
On the heels of the efforts to contain current spending, expenditures have increased more recently
Major determinants of the increase in spending • In 2005/06, total expenditures increased, mainly driven by the rise in wages and compensation of government employees* (by 12.5%) following election promises to increase salaries; in addition to the increase in subsidies, grants and social benefits (by131.9%). • In 2007/08, rising food and energy prices pushed up government expenditures with expenditure on subsidy reaching 10% of GDP. • In 2008/09, large increases in compensation of government employees raised expenditures. Moreover, the government introduced an additional LE billion 14.4 fiscal stimulus package to boost economic growth, which further increased expenditures. *This covers employees of Central Administration and Local Governments, and Public Services Authorities.
Developments in expenditure composition over time Subsidies are expected to grow and remain the largest share of expenditures in 2010/11, in addition to notable increases in expenditures on wages and salaries and the cost of servicing existing debt, i.e. interest payments. * Estimated. * * Budget.
On the heels of successful consolidation efforts, the deficit has surged more recently
The increase in primary expenditures surpassed that of revenues, widening the primary deficit recently
Underlying the increase in primary expenditures has been a recent surge in subsidies and grants
Breakdown of subsidies by category More than two thirds of total subsidies are for fuel products while food subsidy is less than one quarter
The increase in subsidies: determinants and implications • In order to decrease the fiscal deficit, the government has been trying to restructure the subsidies scheme. • However, during the course of reform, emerging global turbulences occurred, specifically: • the notable hike in world food and energy prices (2007-2008) • followed by the global financial turmoil (late 2008 to present) • This increasingly challenged the ability of economic policy to commit to subsidy reform.
Petroleum Subsidy* *This part of the presentation draws on Abouleinein, El-Laithy and Kheir-El-Din (2009), ECES Working Paper No. 145
Subsidization of Petroleum Products in Egypt: Main Issues The Impact of Phasing Out Petroleum Subsidies in Egypt • What is the size of petroleum subsidies? • What is the expected impact of phasing out petroleum subsidies? • Who benefits from these subsidies? • What can we learn from international experiences?
What is the size of petroleum subsidies? Costs, prices and subsidies of petroleum products (2008/09) Source: People’s Assembly , Plan and Budget Committee (March 2010). Final Accounts for fiscal year 2008/2009
What is the size of petroleum subsidies? Ratios of domestic prices and subsidies to actual costs of petroleum products in 2008/09 Note: In the last column (all petroleum products), the subsidy, and the domestic price, are each calculated as a weighted average. Weights are taken as each product’s share in total consumption of petroleum products.
What is the size of petroleum subsidies? The structure of subsidies of petroleum products (2008/09) The structure of consumption of petroleum products (2006/07) Source: Final Accounts, Plan and Budget Committee, People’s Assembly for fiscal year 2008/2009 Source: Abouleinein, El-Laithy and Kheir-El-Din (2009) from the updated i/o tables 06/07.
What is the size of petroleum subsidies? Petroleum subsidy: various indicators Source: Ministry of Finance, Financial Monthly, July 2010
What is the impact of phasing out petroleum subsidies on consumer prices? • Estimation of the direct and indirect impacts of phasing out subsidies of various petroleum products was done using input/output tables for 2006/2007 data (23 sectors consolidated into 7). • Estimation of these impacts depends on: - The increase in the price of each petroleum product. - The weight of each product in the total cost structure of the various sectors. - The weight of each product in the households’ final consumption. - The pattern of linkages among the various sectors.
What is the impact of phasing out petroleum subsidies on consumer prices? • The sectors that are represented in the input/output analysis consist of: • Electricity • Energy intensive industries • Other industries • Transport and communications • Hotels and restaurants • Construction • Other Services That, in addition to the petroleum products (natural gas, fuel and diesel oil, LPG and gasoline).
What is the impact of phasing out petroleum subsidies on consumer prices? The share of each sector in total consumption of petroleum products Source: Abouleinein et al. (2009) based on the updated Input-Output Table 2006/2007
What is the impact of phasing out petroleum subsidies on consumer prices? Increases in prices of petroleum products under two alternative scenarios *Here we consider phasing out subsidy of natural gas used for electricity only. That is because electricity is the main consumer of natural gas. The price of gasoline is a weighted average.
What is the impact of phasing out petroleum subsidies on consumer prices? The contribution to CPI inflation if the price of each petroleum product is increased separately by 1% Note: Last column (cumulative increase in CPI) is the %-point increase in CPI if prices of all petroleum products was increased by 1%. Source: Calculated based on Abouleinein et al. (2009)
What is the impact of phasing out petroleum subsidies on consumer prices? Scenario 1: Raising the price of each petroleum product by 10% Source: Abouleinein et al. (2009) Note: Last column of the left panel (cumulative increase in CPI) is the %-point increase in CPI inflation if prices of all petroleum products are increased by 10%.
What is the impact of phasing out petroleum subsidies on consumer prices? Scenario 2: Removing subsidy of each petroleum product Note: *Natural Gas is for electricity only. Source: Calculated based on Abouleinein et al. (2009) Note: Last column of the left panel (cumulative increase in CPI) is the %-point increase in CPI inflation if all petroleum subsidies are removed completely.
Who benefits from the petroleum subsidy? Distribution of petroleum subsidy by expenditure quintiles in urban and rural Egypt • The richest urban quintile benefits from 33 percent of these subsidies, while the poorest urban quintile benefits from only 3.8%. • Raising the price of natural gas and fuel oil (mazot) affects the lower expenditure quintiles more. Both (Natural gas and mazot) account for only 13% of total petroleum subsidies.
What are the alternatives of phasing out the subsidy? • A CGE model was applied to experiment 4 alternative scenarios to a Reference Path. • The 4 scenarios assume that the subsidy is gradually reduced, until it is completely eliminated in 2012/2013. Scenario 0: Reference Path: maintaining the subsidy, and continuing the economic policies and development trends that are planned for the period 2007/08-2012/13.
What are the alternatives of phasing out the subsidy? Scenario 1: Adjustment of petroleum product prices gradually; no compensations. Scenario 2: Adjustment of petroleum product prices with the increased government cash transfers to the poorest two quintiles (poorest 40%) by 20% in both urban and rural areas. Scenario 3: Adjustment of petroleum product prices, and 50% of energy subsidy savings are transferred to all households (untargeted). Scenario 4: Adjustment of petroleum product prices, and 50% of energy subsidy savings are transferred and targeted to the poorest two quintiles in both urban and rural areas.
What are the alternatives of phasing out the subsidy? Average annual growth rates of total consumption of Households by quintiles The reference path shows very small disparity between consumption of highest & lowest quintiles. However, Scenario 4 shows the largest disparity. This suggests that under the reference path, subsidization is untargeted, and thus is not equitable, whereas scenario 4 seems more in favor of the poorest.
What are the alternatives of phasing out the subsidy? • Inequality is measured as the ratio between consumption of the richest and poorest quintiles (where the smaller measure indicates less inequality). • Income distribution measures are the highest in the Reference Path, signaling the highest level of inequality, compared to all four scenarios. • The ratio of rich to poor consumption is the lowest in Scenario 4, where the petroleum subsidies are phased out, while 50% of the savings are directed to the most needy groups. • Bottom line: Inequality measures improve when subsidy is removed while the poor get compensated .
Lessons learned from International Experiences International experiences indicate that the reform of the price structure of petroleum products should be preceded and complemented by some measures, including the following: 1- Launching an awareness campaign, focusing on (Indonesia’s experience): - Explaining the need for, and the reasons behind the price adjustment. - Identifying winners and losers. - Announcing clear measures to compensate the losers.
Lessons learned from International Experiences 2- Evaluating the impact of this reform on the poverty rate, health, and environment. That, in addition to identifying the group that should be targeted to receive compensatory assistance. 3- Reforming social aid programs in order to better address the needs of the poor target groups. 4- Determining the amount (or the level) of assistance needed for each target group. 5- Determining the suitable mechanisms to assist each target group, and identifying the administrative capacity needed for each. 6- Considering further indirect compensatory measures. 7 – Determining the time frame to implement the petroleum price adjustment program.
Lessons learned from International Experiences The following mechanisms were implemented in several countries to support the targeted groups: 1- Direct cash transfers. 2- Direct transfers using smart cards or coupons. 3- Short-term indirect compensatory measures. (International experiences to follow)
Lessons learned from International Experiences Examples of indirect compensatory measures for increases in energy products prices:
Food Subsidy * *This part of the presentation draws on Abouleinein, El-Laithy, Helmy, Kheir-El-Din and Mandour (2010), ECES Working Paper No. 157
Peak prices Developments in food and consumer prices • Soaring global food prices were reflected in escalating domestic food prices (which constitute almost half the Consumer Price Index (CPI) basket), resulting in a higher cost of living
Developments in food and consumer prices (Cont’d) • From February 2007 to February 2008, the impact of food price inflation on overall inflation in Egypt was large:
Developments in food and consumer prices (Cont’d) Food absorbs 41.5 percent of total household expenditures and accounts for 54 percent of total expenditures of the poorest Egyptian households.
Food price shock and the fiscal budget in Egypt • The impact of the price shock was most significant on the middle and lower income groups in the Egyptian society. • The result was higher price pressures that required additional resources • to alleviate the impact of such price shock on the most vulnerable social groups and • to preserve social and economic stability. • As such, the Egyptian Parliament endorsed Law number 114/2008 with the objective of enacting sustainable revenue measures to offset the additional budgetary outlays associated with higher spending on wages, pensions, and food subsidies in excess to what was originally proposed in the government’s 2008/09 draft budget.
Food price shock and the fiscal budget in Egypt (Cont’d) • Details of additional costs and financing sources of higher wages, pensions and subsidies bills (Values in LE billion)
The structure of the food subsidy system • Food subsidies are provided through two main channels: • the subsidy for “baladi” bread (82 percent extraction rate) which is universal and • the ration cards which offer eligible households a pre-determined monthly quota of basic foodstuffs (including rice, sugar and edible oil) for a maximum of four persons registered on each card. • The table below indicates the prices of the subsidized, partially subsidized and non subsidized bread types:
Increase in subsidies with international prices • Food subsidy in Egypt, 2005/06- 2010/11
Increase in subsidies with international prices (Cont’d) • Dramatic rises in global prices since mid 2006 have increased the food subsidy ratio to GDP from 1.3 percent in 2006/07 to 1.8 percent in 2007/08 and 2.02 percent in 2008/09 • Part of the increase in the subsidy bill is due to • the increase of ration quantities and • the expansion of ration cards coverage. • In response to soaring food prices: • The government decided in 2008 to update the registration for the food subsidy program to allow those born after 1989 to be registered in the system of ration cards. • An extra 22 million people were added, expanding the coverage of the ration card subsidy system to nearly 69.2 million beneficiaries by November 2008. • In addition, the quantities of subsidized food items for all ration cards were increased. • As of November 2008, ration cards supply additional quantities of rice, sugar and vegetable oil, at prices well below their free market value
Increase in subsidies with international prices (Cont’d) • Nearly 69 percent of the 2008/09 food subsidy bill is allocated to baladi bread, while 31 percent is dedicated to other subsidized items, including sugar, rice and edible oil through the ration card system. • Fiscal cost of food subsidies in 2006/07, 2007/08 and 2008/09 (LE million, nominal)
Subsidies and social equity • Four out of five households in Egypt purchase subsidized baladi bread • 67 percent have ration cards • The three middle quintiles have the largest share of households that purchase baladi bread • On the other side, the share of ration card holders decreases as expenditure increases. • Since, baladi bread is available for everybody while certain criteria are used to exclude the rich from ration card system. Percentage of households receiving food subsidies by quintiles
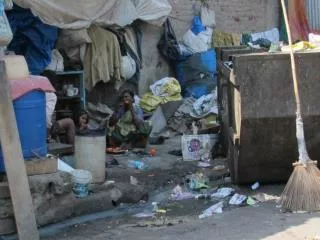
Subsidies and social equity • Other problems in the bread subsidy: • Flour is highly subsidized to the bakeries and as a result it leaks to the black market. • This is mainly attributed to the large number of bakeries which make it difficult for monitoring. • Subsidized bread is cheaper than animal feed: • Many Egyptian cattle and poultry growers abuse the effort of the government to provide subsidized bread for low income groups and use it to feed their animals. • This creates bread shortages and brings to light the weakness of a state subsidized economic model.
Subsidies and social equity • Food subsidies are poorly targeted and unnecessarily expensive, resulting in substantial leakage of resources to high-income households. • Per capita absolute benefits of food subsidies per annum
International comparison of food subsidies • Despite the longstanding provision of in-kind food subsidies in Egypt and the expansion of the overall coverage of the food subsidy program over the past number of years, poverty continues to rise and a large proportion of people remain highly vulnerable to food insecurity and malnutrition. • Subsidies and transfers spending and indicators for Egypt and selected countries: