Download
1 / 14
140 likes | 255 Vues
Tropical forcing for the interannual variability of the subtropical high. Pei-Hsuan Chung and Chung-Hsiung Sui Department of Atmospheric Sciences, National Central University, Jhong Li, Taiwan Tim Li Department of Meteorology and IPRC, University of Hawaii, Honolulu, Hawaii, USA.

E N D
Tropical forcing for the interannual variability of the subtropical high Pei-Hsuan Chung and Chung-Hsiung Sui Department of Atmospheric Sciences, National Central University, Jhong Li, Taiwan Tim Li Department of Meteorology and IPRC, University of Hawaii, Honolulu, Hawaii, USA
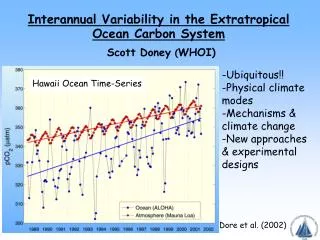
OBS Analysis Sui, C. -H., P. -H. Chung, and T. Li, 2007: Interannual and interdecadal variability of the summertime western North Pacific subtropical high. Geophys. Res. Lett., 34, 253 L11701, doi:10.1029/2006GL029204. Time Series WNPSHI = H500 anom (120-140E, 10-30N)
Power Spectrum of WNPSH Index Time Filtering: 2-3-yr and 3-5-yr WNPSH Index
Shading: vertical p-velocity (Pa/s) Vectors: significant W500 (m/s) Color contours: OLR (W/m2) Black contour: H500 (unit: m)
Shading: vertical p-velocity (Pa/s) Vectors: significant W500 (m/s) Color contours: OLR (W/m2) Black contour: H500 (unit: m)
What are the key SSTA forcing dominated in 2-3-yr and 3-5-yr oscillations of the westwarding WNP subtropical high? Model Simulation
QTCM Model • QTCM : Quasi-equilibrium Tropical Circulation Model with a single vertical structure of temperature and moisture for deep convection • Intermediate complexity atmospheric model • The model formulation makes use of the constraints placed on the flow by deep convection, as represented by quasi-equilibrium (QE) convective parameterizations
Experiment design Control SST Run • 1958-2005 monthly mean SST to run 50 years simulations and use the middle 30 years results Prescribe SSTA Run • MJJA : Add (High-Low) composite SSTA in some key regions • JFMA and SOND : Climate SST as CTRL • Prescribe SSTA Run - Control SSTA Run
2-3-yr oscillation MJJA SSTA (High-Low) Comp MC Run CEP Run
MC Run CEP Run Total Run
WNP Run 3-5-yr oscillation MJJA SSTA (High-Low) Comp IO+EP Run
WNP Run EP+IO Run Total Run
Discussion • 2-3-yr oscillation ~ Total run • 3-5-yr oscillation ~ WNP run (local cold SSTA) • Using “heating” instead of SSTA • GCM models