Download
1 / 18
180 likes | 266 Vues
The integration of environmetal aspects in the Barcelona Urban Mobility Masterplan. Julio García 29th March 2007. Index. Urban Mobility Masterplan: main features and background. Urban traffic flows 1965-2005 and 1993-2005. Mobility tendency and future prognosis.

E N D
The integration of environmetal aspects in the Barcelona Urban Mobility Masterplan Julio García 29th March 2007
Index • Urban Mobility Masterplan: main features and background. • Urban traffic flows 1965-2005 and 1993-2005. • Mobility tendency and future prognosis. • Future Barcelona Mobility-Environmental Model. • Actions to reduce environmental consequences. • Mobility Observatory.
Barcelona Urban Mobility Masterplan: main features Urban Mobility Masterplan 2006-2012-2018 Planning instrument (Mobility Director Plan and Mobility National Directives) Define future mobility strategies Citizens’ participation: ‘Mobility Pact’ Environmental aspects Identify supramunicipal dynamics
Barcelona Urban Mobility Masterplan: background Different frameworks: International (Kyoto Protocol) European (transport, energy, noise, air quality, etc) National (Insfrastructure National Masterplan, Energy Strategy in Spain: save and efficiency, Air quality Law, etc) Regional (Mobility Law 9/2003, Energy Plan, etc). Municipal (Barcelona Energy Plan, Agenda 21, etc)
Urban traffic flows 1965-2005 Heavy increases ... 1965 1986 2005
Urban traffic flows 1993-2005 ... lower increase. 1993 2000 2005
On foot 47.2% Private 23.1% Public 45.8% Mod e of transport Internal % Int/Ext % Total % Private Car 1.026.667 23,1% 1.335.601 52,2% 2.362.268 33,8% Public Transport 1.314.000 29,6% 1.172.200 45,8% 2.486.200 35,6% Foot and bicycle 2.094.208 47,2% 49.000 1,9% 2.143.208 30,7% 4.434.875 2.556.801 6.991.676 On foot 1.9% Public 29.6% Private 52.2% Int-ext trips :2.556.801 Internal trips:4.434.875 Mobility tendency and future prognosis Current situation (2006)
Modeof transport Internal % Int/Ext % Total % Private Car 1.298.871 21,3% 1.647.457 47,1% 2.946.328 30,7% Public Transport 1.585.970 26,0% 1.774.553 50,7% 3.360.523 35,0% Foot and Bicycle 3.207.137 52,6% 75.040 2,1% 3.282.177 34,2% 6.091.978 3.497.050 9.589.028 Mobility tendency and future prognosis Future Tendency (2018) 2.946.000 private car trips mean 20,8 milion of veh-km/day, of which 24,5% will be realised within congestion levels higher than 90% (13% in 2004) It’s not sustainable in mobility and environmental framework!!
Mode of transport Internal % Int/Ext % Total % Private Car 1.055.710 17,3% 1.363.714 39,0% 2.419.424 25,2% Public Transport 1.810.132 29,7% 2.054.835 58,8% 3.864.967 40,3% Foot and Bicycle 3.226.136 53,0% 78.501 2,2% 3.304.637 34,5% 6.091.978 3.497.050 9.589.028 Mobility tendency and future prognosis Alternative A: Keep the current levels of congestion (Mobility Pact) - All new trips within 2006-2018 would be realised by public transport and on foot and bicycle. - 525.000 trips would be removed from private car to public transport.
Mode of trnasport Internal % Int/Ext % Total % Private Car 889.705 14,6% 932.002 26,7% 1.821.707 19,0% Public Transport 1.963.166 32,2% 2.481.281 71,0% 4.444.447 46,3% Foot and Bicycle 3.239.106 53,2% 83.768 2,4% 3.322.874 34,7% 6.091.977 3.497.051 9.589.028 Mobility tendency and future prognosis Alternative B: Kyoto Protocol We integrate the environmental aspects: Total emissions CO2 < 1,15 Total emissions CO2 (1990)
Mobility tendency and future prognosis Alternative B: Kyoto Protocol 13.2 million of vehxkm would be realised (20% less than 2006) and 9,4% of the network would be congested over levels higher than 90%. The necessary public transport infrastructure supply to guarantee the new modal split (46% public transport) would exceed 2018
Mobility tendency and future prognosis Final Mobility Model Main goal: keep the current congestion levels of traffic network (2006) and the Kyoto Protocol • Hypothesis: • Increase the average occupancy of vehicles from 1,2 to • 1,4 persons/vehicle. • 120 g/km of CO2 as average production in all vehicles fleet • (the European Comission goal is to achieve 120 g/km of CO2 in • new vehicles in 2010)
Mode of transport Internal % Int/Ext % Total % Private Car 1.129.720 18% 1.459.317 42% 2.589.038 27,00% Public Transport 1.706.514 28% 1.937.317 56% 3.643.831 38,00% Foot and Bicycle 3.276.435 54% 79.725 2% 3.356.160 35,00% TOTAL 6.112.669 100% 3.476.359 100% 9.589.028 100,00% Mobility tendency and future prognosis Final Mobility Model • The vehxkm/day would be 6% less than nowadays. • Internal public transport trips should increase 30% (392.514) • Internal-external public transport trips should increase 65% (765.117) • Revision of the Infrastructure Director Masterplan (ATM-2006?) • Revision of the Train Masterplan (Adif, RENFE, FGC)
Barcelona final mobility model Strategic goals: • Safe mobility:Reduction of number of accidents. • Sustainable mobility:Reduction of mobility environmental consequences. • Equal mobility: The right to mobility. • Efficient mobility: Reduction of mobility as a necessity, optimising supply.
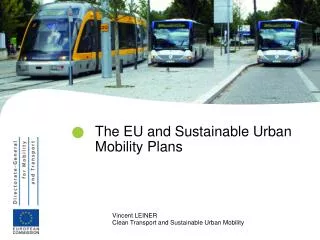
Actions to reduce environmental consequences • Increase more sustainable public transport fleets (NGC, fuel cell, biodiesel, etc). • For example: TMB has 250 NCG buses and 1 fuel cell bus. • Increase more sustainable municipal fleets (NGC, fuel cell, biodiesel, etc). • For example: electric vehicles in the Municipal Cleaning Fleet. • Campaigns to promote clean vehicles in private cars and goods distribution. • For example: reduction of IVTM or logistic platform with electric vehicles pilot test).
Actions to reduce environmental consequences - Promote night goods distribution (Fideus Project). - Annual control of pollution emissions evolution. - Promote those more sustainable modes (Bicing, walking, etc). - Promote environmental management systems in transport enterprises. - Evaluate environmental external costs. - Annual renew of the Barcelona pollution map.
Mobility Observatory DNM: Mobility National Directives TERM: Transport and Environment Reporting Mechanism PEIT: Infrastaructure Transport Strategic Plan
Mobility Observatory DNM: Mobility National Directives TERM: Transport and Environment Reporting Mechanism PEIT: Infrastaructure Transport Strategic Plan