Download
1 / 101
1.09k likes | 1.72k Vues
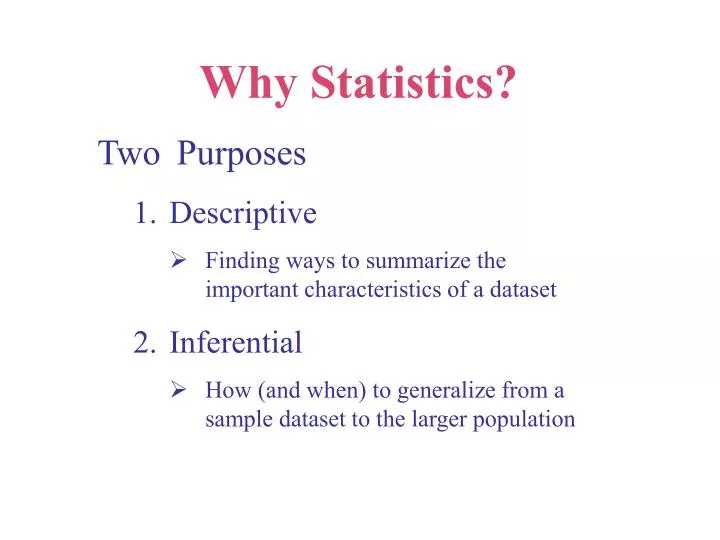
Why Statistics?. Two Purposes Descriptive Finding ways to summarize the important characteristics of a dataset Inferential How (and when) to generalize from a sample dataset to the larger population. Descriptive Statistics. Firsthand Impression. Secondhand Impression. 3.88 3.38 1.88 .63

E N D
Why Statistics? • TwoPurposes • Descriptive • Finding ways to summarize the important characteristics of a dataset • Inferential • How (and when) to generalize from a sample dataset to the larger population
Firsthand Impression Secondhand Impression 3.88 3.38 1.88 .63 2.00 3.13 3.88 4.25 2.50 .50 3.25 3.75 3.13 1.50 1.50 1.88 3.75 .88 2.00 2.25 2.38 1.13 3.25 3.38 2.88 1.00 .88 -.25 3.50 1.63 4.13 1.50 .38 2.00 4.63 2.13
Firsthand Impression Secondhand Impression 3.88 3.38 1.88 .63 2.00 3.13 3.88 4.25 2.50 .50 3.25 3.75 3.13 1.50 1.50 1.88 3.75 .88 2.00 2.25 2.38 1.13 3.25 3.38 2.88 1.00 .88 -.25 3.50 1.63 4.13 1.50 .38 2.00 4.63 2.13
Characterizing a Distribution of Data frequency
Men Women frequency frequency • Comparing Distributions of Data How could you summarize the differences?
Looking for Linear Relationships Anger during Conflict
Looking for Linear Relationships Current relationship satisfaction
Comparing Linear Relationships Current relationship satisfaction Anger during Conflict How could you summarize the differences?
Current relationship satisfaction • Complex Linear Relationships
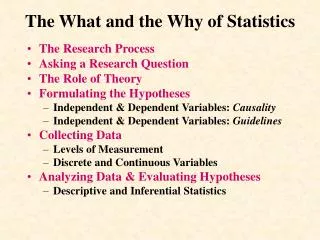
Descriptive Statistics Provides graphical and numerical ways to organize, summarize, and characterize a dataset.
Types of Studies • Experimental: • The predictor variable is manipulated by the researcher. • Observational: • The predictor variables are merely observed and recorded by the researcher.
Types of Variables • Predictor variable: • The antecedent conditions that are going to be used to predict the outcome of interest. If an experimental study, then called an “independent variable”. • Outcome variable: • The variable you want to be able to predict. If an experimental study, then called a “dependent variable”.
Ordinal Categorical A set of categories that are organized in an ordered sequence A set of categories that have different names Types of Variables • Continuous variable: • There are an infinite number of possible values that fall between any two observed values. • Discrete variable: • Consists of separate, indivisible categories
Frequency Tables Frequency Eye Color 33 14 3 Brown Blue Green
Frequency Tables Relative Frequency Frequency Eye Color 66% 28% 6% 33 14 3 Brown Blue Green
Frequency Tables Hours of Sleep Frequency 1 3 6 14 16 5 3 2 3 - 4 hrs 4 - 5 hrs 5 - 6 hrs 6 - 7 hrs 7 - 8 hrs 8 - 9 hrs 9 - 10 hrs 10 - 11 hrs
Relative Frequency 2% 6% 12% 28% 32% 10% 6% 4% Frequency Tables Hours of Sleep Frequency 3 - 4 hrs 4 - 5 hrs 5 - 6 hrs 6 - 7 hrs 7 - 8 hrs 8 - 9 hrs 9 - 10 hrs 10 - 11 hrs 1 3 6 14 16 5 3 2
Cumulative Frequency 2% 8% 20% 48% 80% 90% 96% 100% Frequency Tables Hours of Sleep Relative Frequency Frequency 3 - 4 hrs 4 - 5 hrs 5 - 6 hrs 6 - 7 hrs 7 - 8 hrs 8 - 9 hrs 9 - 10 hrs 10 - 11 hrs 1 3 6 14 16 5 3 2 2% 6% 12% 28% 32% 10% 6% 4%
Stem Leaves 2 3 4 5 6 2 5 4 5 1 1 5 6 7 4 9 0 • Stem and Leaf Plots
Stem Leaves 2 3 4 5 6 2 5 4 5 1 1 5 6 7 4 9 0 • Stem and Leaf Plots
Stem Leaves 2 3 4 5 6 2 5 4 5 1 1 5 6 7 4 9 0 • Stem and Leaf Plots
men women 4 1 1 5 6 9 2 3 4 5 6 2 5 5 7 4 0 • Back-to-Back Stem and Leaf Plots
Visual Depictions of Distributions Summary Discrete Data Frequency Tables Bar Graphs Continuous Data Frequency Tables Bar Graphs Stem and Leaf Plots
Visual Depictions of Relationships IV -- categorical; DV -- continuous • Charts
Visual Depictions of Relationships IV -- categorical; DV -- continuous • Bar Graphs
Visual Depictions of Relationships IV -- categorical; DV -- continuous • Bar Graphs Look at the same graph differently!
Visual Depictions of Relationships IV -- categorical; DV -- continuous • Bar Graphs Look again!
Visual Depictions of Relationships IV -- categorical; DV -- continuous • Line Graphs
Voice Implicit Theory Visual Depictions of Relationships IV -- categorical; DV -- continuous • Box-plots
Person attributions Implicit Theory Visual Depictions of Relationships IV -- categorical; DV -- continuous • Error-bar plots
Current relationship satisfaction Visual Depictions of Relationships IV -- continuous; DV -- continuous • Scatterplots
Current relationship satisfaction Visual Depictions of Relationships IV -- continuous; DV -- continuous • Scatterplots
Visual Depictions of Relationships IV -- continuous; DV -- continuous • Scatterplots with regression lines Current relationship satisfaction
Visual Depictions of Relationships IV -- categorical; DV -- categorical • Contingency table
IV -- categorical; DV -- continuous • Charts, bar graphs, line graphs, box plots, error bar plots IV -- continuous; DV -- continuous • Scatterplot (regression line) IV -- categorical; DV -- categorical • Contingency table Visual Depictions of Relationships
Inferential statistics Inferential Statistics • Population: • The set of all individuals of interest (e.g. all women, all college students) • Sample: • A subset of individuals selected from the population from whom data is collected
Some important terms • Parameter: • A characteristic of the population. Denoted with Greek letters such as or . • Statistic: • A characteristic of a sample. Denoted with English letters such as X or S. • Sampling Error: • Describes the amount of error that exists between a sample statistic and the corresponding population parameter.
We want to know whether Joe is an above average free-throw shooter. We collect some data
B B B M M M B B B B B B B B M M % baskets = .75 M M B B M % baskets = .63 B B M % baskets = .58 Would you bet $10.00 that he makes the next shot?
H H H T T T H H H H H H H H T T % heads = .75 T T H H T % heads = .63 H H T % heads = .58 • Chance is “Lumpy”