Download

1 / 29
290 likes | 475 Vues
Flowcharting. Paul King V. U. School of Engineering. Overview. This Lecture will overview flowcharting of processes. Elementary to detailed charting will be covered. Why Flowchart???. Document the process. Allow study of roadblocks Allow display of timing & conditionals.

E N D
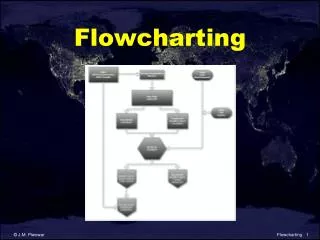
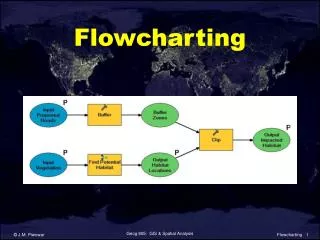
Flowcharting Paul King V. U. School of Engineering
Overview • This Lecture will overview flowcharting of processes. • Elementary to detailed charting will be covered.
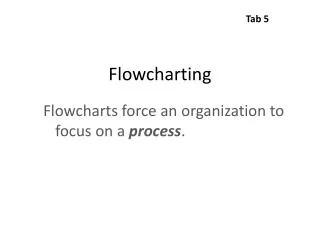
Why Flowchart??? • Document the process. • Allow study of roadblocks • Allow display of timing & conditionals. • Provide a communication tool.
Examples to follow: • Hinge Manufacture • Hypertension Clinic #1 • Hypertension Clinic #2 • The ideal? • ABET Diagram • Breast Cancer Clinic.
Hypertension Clinic - Flow Study #1 • Patient enters, signs in, waits in waiting room until called • Patient goes to weigh-in room, weight & pulse rate taken, medications reviewed (RN). • Patient goes to new waiting room. • Patient is sent to room, put on bed, lights out, 2 minute wait, BP taken (RN). • Patient to waiting room • Patient to clinic room ...
Hypertension Clinic - Flow Study #1, Continued • Patient interviewed by MD or Resident/MD, BP taken? • Patient medications reviewed, lifestyle, needs. • Patient discharged & rescheduled and tests ordered if necessary or admitted...
Flowchart: Hypertension Clinic # 1 Delay 1 2-10Delay 2 2-20Delay 3 5-20Delay 4 5-20 Overall waiting time: 14-70 Actual patient interaction 7
Discussion • Using delay symbols for patient wait states stresses delays • Each delay is in fact a wait for event, simplified here. • Waiting times may be expressed as here, or as color bars for easy identification of outlier cases • Actual overall waiting times have ranged up to 100 minutes
Flowchart: Hypertension Clinic #2 Delay 1 2-10Delay 2 2-20Delay 3 5-20 Overall waiting time: 9-50 Actual patient interaction 7
Discussion • Using delay symbols for patient wait states stresses delays • Overall delay time has dropped. • Delay 2 & 3 may be combined... • Actual overall waiting times have decreased
Future Clinic Structure? Time in-out 7-20
Discussion • While the chart is more complicated, the process is easier for most patients. • MD time is utilized for “needy” patients. • RN time is used for less needy. • Many patients will be status quo. • This is approximately the dentist office model..
Determine educational objectives Determine Outcomes Required to Achieve Objectives Determine How Outcomes will be Achieved Evaluate/Assess Determine How Outcomes will be Assessed Input from Constituencies Formal Instruction Student Activities Establish Indicators that Objectives are Being Achieved The Two Loops of EC2000
Discussion • Flowcharting in this fashion is far more powerful than the written text. • Flowcharts can be used to make a point of interactions between several factors.
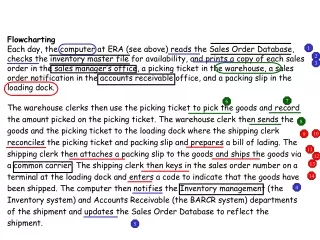
Typical Undergraduate Flowcharting Project • Breast center, 50 patients a day • Categorize (normal v next step) • Interview a subset • Observe interactions and flow over three months • Walk through the problem. • Interview staff. • Flowchart data, analyze data, recommend changes.
Michelle E. Kandcer, B.S. Doris Quinn, PhD, Advisor PATIENT FLOW ANALYSIS OF VANDERBILTBREAST CENTER
PROJECT DEFINITION • The goal of this project is to assess and to improve the patient flow process in Vanderbilt’s Breast Cancer Center. Patient responses will be of significant consideration.
OBJECTIVES • To create a flowchart in (Micrografx Flow-Charter 7.0) that will describe the current patient flow process. • To highlight weaknesses of the process. • To emphasize (on the flowchart) patients’ feelings regarding the process. • To make suggestions as to how to improve the current process.
SIGNIFICANCE • The American Cancer Society estimates that 178,700 women will be diagnosed with breast cancer this year alone and that 3,900 of these women will be from Tennessee. Furthermore, another 43,500 women will die because of this disease. * • Currently, more than 50 women per day utilize services provided by the Cancer Center.
WORK COMPLETEDProcess Flow for those Needing Mammograms (continued)
WORK COMPLETEDProcess Flow for those NotNeeding Mammograms (continued)
Summary • Flowcharting works!. • Flowcharting is a useful tool.