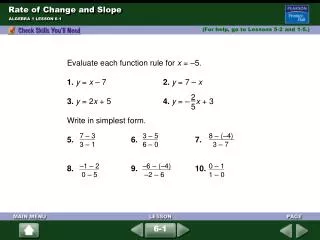
Download
1 / 18
180 likes | 284 Vues
Ch 1.3 - Graphs of Functions Ch 1.4 - Slope and Rate of Change. Ch 1.3 Graphs of Functions (Pg 39)( Ex 1) Reading Function Values from a Graph. Output variable. The Dow-Jones Industrial Average value of the stock prices is given as a

E N D
Ch 1.3 - Graphs of FunctionsCh 1.4 - Slope and Rate of Change
Ch 1.3 Graphs of Functions (Pg 39)( Ex 1)Reading Function Values from a Graph Output variable The Dow-Jones Industrial Average value of the stock prices is given as a function of time during 8 days from October 15 to October 22 2500 2400 2300 2200 2100 2000 1900 1800 P (15, 2412) f(15) = 2412 f(20) = 1726 Dow Jones Industrial Average Dependent Variable Q (20, 1726) Time Independent Variable 12 13 14 15 16 19 20 21 22 23 October 1987 Input variable
Graph of a function ( pg 39) The point ( a, b) lies on the graph of the function f if and only if f (a) = b Functions and coordinates Each point on the graph of the function f has coordinates ( x, f(x)) for some value of x
Finding Coordinates with a Graphing CalculatorPg = 41 Graph the equationY = -2.6x – 5.4 X min = -5, X max = 4.4, Y min = - 20 , Y max = 15 Press Y1 enter Press 2nd and Table Press Graph and then press, Trace and enter “Bug” begins flashing on the display. The coordinates of the bug appear at the bottom of the display.Use the left and right arrows to move the bug along the graph
Vertical Line Test ( pg - 43) A graph represents a function if and only if every vertical line intersects the graph in at most one point One point Two points FunctionNot a function Go through all example 4 ( pg 43- 44)
Graphical Solution of Inequalities (Pg – 45, 46) x 0 2 4 6 8 10 12 285 – 15x 285 255 225 195 165 135 105 Consider the inequality 285 – 15x > 150 300 200 150 100 - 100 y = 285 – 15x 5 9 10 25 The solution is x< 9
Ex 1.3 No 4 (pg 49) f Highest point (3, 6) y-intercept 6 5 4 3 2 1 (0,5) f(f) (4, 5) (-1,3) x- intercept (-2, 0) - 5 -4 -3 -2 -1 1 2 3 4 5 t (- 4, -1) Lowest point a) Find f(-1) and f(3) The points (-1,3) and (3,6) lie on the graph so f(-1) = 3 and f(3) = 6 b) For what value(s) of t is f(t) = 5? The points (0,5) and (4,5) lie on the graph so f(t) = 5 when t = 0 and t = 4 c) Find the intercepts of the graph. List the function values given by the intercepts The t-intercept is ( -2, 0) and the f- intercept is ( 0, 5) ; f(-2) = 0 , f(0) = 5 d) Find the maximum and minimum values of f(t) The highest point is (3, 6) and the lowest is ( -4, -1) , so f(t) has a maximum value of 6 and a Minimum value of – 1 e) For what value(s) of t does f take on its maximum and minimum values? The maximum occurs for t = 3 The minimum occurs for t = - 4 f) On what intervals is the function increasing ? Decreasing ? The function increasing on the interval ( - 4, 3 ) and decreasing on the interval ( 3, 5 )
No. 13. Make a table of values and sketch a graph( Use calculator) Pg 51 Enter Y1 Enter the values in window Hit 2ndand table Hit Graph
No. 35 ( Pg 55)Graph y1 = 0.5x3 – 4xEstimate the coordinates of the turning point ( Increasing and decreasing or vice versa and write equation of the form F(a) = b for each turning point Enter Y1 Enter Window Hit Graph ( -1.6, 4.352) ( 1.6, 4.352) Turning points are approximately ( -1.6, 4.352) and ( 1.6, - 4.352) And equations are F ( - 1.6) = 4.352 F(1.6) = -4.352
1.4 Measuring Steepness ( pg 57) Which path is more strenuous ? 5 ft 2 ft Steepness measures how sharply the altitude increases.. To compare the steepness of two inclined paths, we compute the ratio of change in horizontal distance for each path
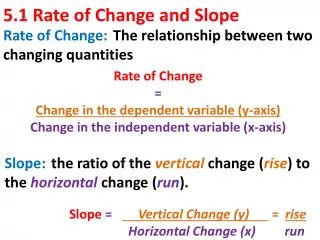
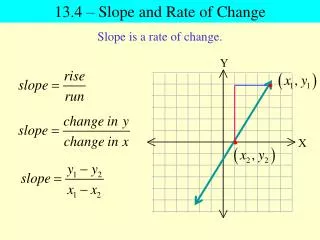
1.4 Slope (Pg 59) Definition of Slope: The slope of a line is the ratio Change in y- Coordinate Change in x- coordinate 5 4 3 2 1 A B 0 2 3 4 Slope = Change in y-coordinate = 5 - 4 = 1 Change in x- coordinate 4 – 2 2
Notation for Slope (Pg 60) Change in y coordinate y x Change in x coordinate Slope of a line is given by y m = x , where x is not equal to zero The slope of line measures the rate of change of the output variable with respect to the input variable
Significance of the slope (Ex 6, Pg 63)The distance in miles traveled by a big-rig truck driver after t hours on the road. Compute the slope and what does the slope tell us ? H (4, 200) 250 200 150 100 50 D = 100 Distance in miles traveled G (2, 100) t = 2 1 2 3 4 5 t No of hours D Change in distance 100miles = = = 50 miles per hour T Change in time 2 hours Slope m = The slope represents the trucker’s average speed or velocity
Formula for Slope two point slope form (Pg 64) y x y2 – y1 x2 m = = = x1 x2 – x1 The slope of the line passing through the points P1(x1, y1) and P2 ( x2, y2) is given by Slope Formula m = y2 – y1 9 -(-6) -15 - 3 x2 – x1= 2 - 7 =5 = 10 5 -5 P1 (2, 9) 10 P2 (7, -6)
Slope formula in Function Notation ( Pg 64 ) m = y2 – y1 f(x2) – f(x1) , x2 = x1 x2 – x1= x2 - x1
Ex 1.4 ( Pg = 67) No 11 .a)Graph each line by the intercept method b) Use the intercepts to compute the slope 2y + 6x = -18 Set x = 0 2y + 6(0) = -18 2y = -18 y = -9 The y-interceptis ( 0,-9) Set y = 0 2( 0) + 6(x) = -18 6x = -18 x = -3 The x- intercept is ( -3, 0) b) Slope m = 0 –(-9) = 9 = - 3 (Use Slope formula ) -3 – 0 -3 x- Intercept (-3, 0) -4 -2 2 -2 -4 -6 -8 y-intercept (0, -9)
No. 34The graph shows the amount of garbage, G (in tons), that has been deposited at a dump site t years after new regulations go into effecta) Choose two points and compute the slope of the graph ( including units )b) Explain what the slope measures in the context of the problem 200 150 100 50 ( 10, 150) (0, 25) 5 10 15 20 Slope m = 150 – 25 = 125 = 12.5 tons per year 10 – 0 10
Evaluate the function at x = a and x = b, and find the slope of the line segment joining the two corresponding points on the graph, illustrate the line segment on a graph of the functionNo 55 h(x)= 4 a) a = 0, b = 6 b) a = -1, b = 2 x + 2 ( -1, 4) (2, 1) ( 0, 2) (6, ½) h(a) = h(0) = 4 = 2 0 + 2 h(b) = h(6) = 4 = 1 6 + 2 2 m = h(b) – h(a) = ½ - 2 = -3/2 = -1/4 b – a 6 – 0 6 h(a) = h(-1) = 4 = 4 (-1) + 2 h(b) = h(2) = 4 = 1 2 + 2 m = h(b) – h(a) = 1 - 4 = -3 = - 1 b – a 2 – (-1) 3