Download
1 / 85
900 likes | 1.13k Vues
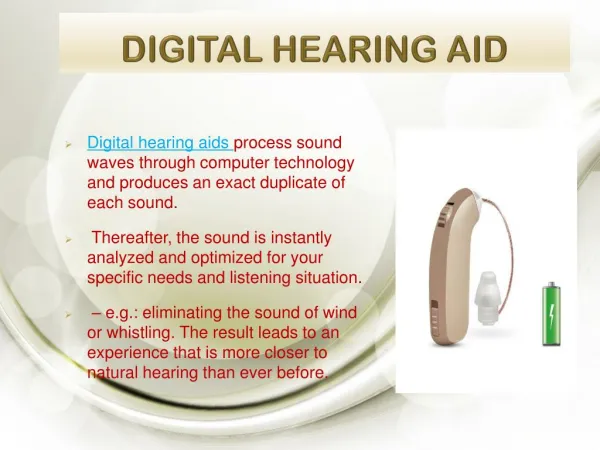
Objective Clinical Verification of Digital Hearing Aid Functions. Colorado Academy of Audiology Fall, 2009. David J. Smriga, M.A. Audiologist Hearing Industry Consultant. Today’s Fitting Realities. In tough economic times, decisions are more carefully considered

E N D
Objective Clinical Verification of Digital Hearing Aid Functions Colorado Academy of Audiology Fall, 2009 David J. Smriga, M.A. Audiologist Hearing Industry Consultant
Today’s Fitting Realities • In tough economic times, decisions are more carefully considered • Today’s sophisticated hearing instruments bring complexities to that decision-making process • An informed decision can not be made based on hearing instrument technology alone
Consider the Process • Your role is to make a decision about “which” hearing aid technology is best for the patient • Once selected, the fitting process shifts to the capabilities (the “logic”) of the fitting software • What happens if the fitting software doesn’t deliver an acceptable final result?
Subjective Authority • Based on impressions that may not always be consistent with better hearing • Too often, placed in the hands of the patient • Can compromise hearing aid utility • There can be a difference between what “sounds good” to the patient and what is in the best interests of the patient
The Fundamental Goal: • To render audible what the hearing loss has rendered inaudible • In particular, to build meaningful audibility of speech
The Hearing Review 2006 Dispenser Survey, June 2006, The Hearing Review
Hearing Journal Dispenser Survey, April, 2006, The Hearing Journal
Traditional REM Wisdom Input Stimulus PT sweep Noise Measure REIG curve Adjust gain to hit a predicted insertion GAIN target REM in the Digital World Input Stimulus Speech “Dynamics” Measure REAR speech banana Adjust gain AND compression to deliver AUDIBILITY to THIS patient Putting REM on Its Probe Tip!
Placing an “Audibility” Context on IG Targets • Take NAL-NL1 (for example): • Procedure seeks to amplify speech such that all bands of speech are perceived with equal loudness • However: • It derives IG targets assuming NOISE as a verification signal
Oh good, it doesn’t matter which I use! For this compression hearing aid...Gain for speech @Gain for tones
Maybe you should just listen to tones. Output for speech is much less than output for pure tones.
The output of a compression aid depends on the nature of its input signal
The output of a compression aid depends on the nature of its input signal
The output of a compression aid depends on the nature of its input signal
Speech Is An Excellent WDRC Measurement Stimulus • It IS the most important input signal that the patient will want to hear well and comfortably • It interacts with multi-band compressors in a more realistic way than tones • band interactions across frequency • changing intensity
The Terminology WE Will Be Using • REAR • Real Ear Aided Response • LTASS • Long Term Average Speech Spectrum • LTAS minima • Eardrum SPL exceeded 90% of the time • LTAS maxima • Eardrum SPL exceeded 10% of the time • RESR • Real Ear Saturation Response
RECDReal-ear-to-coupler difference • The difference in dB across frequencies between the SPL measured in the real-ear and in a 2cc coupler, produced by a transducer generating the same input signal. 1) Recruitment Accommodation
RECD MeasurementHow is it done? • Composed of 2 measurements: 2cc coupler measurement and real-ear measurement. 1) Recruitment Accommodation
How do we measure RECD ? Measuring the coupler response of the insert earphone
Real-ear response Coupler response Average RECD RECD Measuring the real-ear response of the insert earphone..
The Verifit uses the RECD to... • Convert threshold and UCL obtained using insert earphones to SPL near the TM • Convert real-ear gain and output requirements to 2cc coupler targets • Convert test box measurements of hearing aid output to estimated real-ear aided response (Simulated Real-Ear Measurements) 1) Recruitment Accommodation
Loud speech Avg. speech Sounds get louder as you go UP the scale Soft speech Understanding an SPLogramThe Unaided SPLogram Maximum output targets dB SPL Eardrum reference Threshold (dB SPL TM) Normal hearing 1) Recruitment Accommodation
DSL 5.0a • Goal: to make speech audible for as broad a range of frequencies as possible • Output based targets • Incorporates average RECD and average REUG into target calculations • Targets are different than prior versions of DSL
NAL-NL1 • Goal: To amplify speech such that all bands are perceived with equal loudness • Gain based, but modified by Audioscan to become an output target • Using the same adult average RECD and REUG used in DSL
Cambridge Aims • Camfit Restoration • To amplify sounds that are soft, comfortable and loud to a normal hearing person so that they are soft, comfortable and loud for the HA wearer. (Stated goal of IHAFF fitting method). • Camfit Equalization • To amplify speech to produce the same loudness in each critical band. It has been argued that this is likely to give the highest intelligibility for a given overall loudness.
= DSL = NAL = CR = CE
Minimal Occlusion Lybarger S. Earmolds. In: Katz J, ed. Handbook of Clinical Audiology, 3rd edition. Baltimore: Williams and Wilkins; 1985: 885-910.
FIGURE 5: The pink shaded area is the eardrum SPL “speech banana” for 65dB speech input measured at the probe tip with the open-fit hearing aid turned OFF. The green shaded area is the eardrum SPL “speech banana” with the same hearing aid turned ON. The difference between the two indicates where amplification has reached the eardrum.
2) Verifying Directionality Function Verifying Digital Performance
0 360 0 15 345 30 330 -5 45 315 60 -10 300 75 -15 285 90 -20 270 105 255 120 240 135 225 150 210 165 195 180 Laboratory Specification of Directionality Polar Plots 2) Directional Verification
Viewport:Digital Functions Summary/ Test Protocol Screen Contains both “Test Box” and “On Ear” Options 4 quadrants – one for each of the 4 digital functions tests Pre-set (but adjustable) protocols
= Secondary input signal (512 pure tones 7.8 Hz apart) Directional Frequency Response Input Stimulus = Main input signal (512 pure tones 7.8Hz apart) Frequency (KHz)
Directionality Test (REM) Verifit System In REM Directional Mode Rear Facing Auxiliary Speaker Subject Aided Ear With Probe Tube Positioned 2) Directional Verification
3) Verifying Noise Reduction Function Verifying Digital Performance
Digital Noise Reduction Properties • Digital algorithm programmed to recognize “non-speech” elements of incoming stimulus • Operates independently in bands • Analyzes incoming signal modulation • Can vary in terms of time constants • Typically, slow attack, fast release 3) Noise Reduction Verification
4) Verifying Feedback Reduction Function Verifying Digital Performance
Digital Feedback Reduction Properties Passive Active Best Overall Application Phase Canceller Poorest Overall Application Notch Filter
Key Factor of Concern • Does the feedback suppression function compromise hearing instrument performance when processing other stimuli? 4) Feedback Reduction Verification