Download
1 / 38
380 likes | 390 Vues
Measuring consumer welfare in the digital economy. Avinash Collis MIT www.avinash.info. How Are We Doing ?. “ ...a measure for standard of living : average real gross domestic product (GDP) per capita ” – Boston Fed

E N D
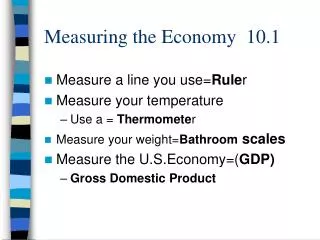
Measuring consumer welfare in the digital economy Avinash Collis MIT www.avinash.info
How Are We Doing? “...a measure for standard of living: average real gross domestic product (GDP) per capita” – Boston Fed “Productivityis the most important determinant of the standard of living” – Forbes
“The welfare of a nation can scarcely be inferred from a measurement of national income as defined [by the GDP.]” - Simon Kuznets, 1934 GDP is a measure of production, not well-being
IT & GDP Explosion of free digital goods
ΔProduction vs. ΔConsumer Surplus Case 1: Classic Goods E.g. Automobiles, haircuts, food GDP ↑, Consumer Surplus ↑
ΔProduction vs. ΔConsumer Surplus Case 2: Digital Goods E.g. Increased use of free maps on smart phones or more digital photos; Special case: Free digital apps that never existed before GDP no change, Consumer Surplus ↑
ΔProduction vs. ΔConsumer Surplus Case 3: Transition Goods E.g. Encyclopedia (Wikipedia vs. Britannica) Chemical photography to digital photography GDP ↓, Consumer Surplus ↑
Using Massive Online Choice Experiments to Measure Changes in Well-being with Erik Brynjolfsson, Felix Eggers
Our Approach • Estimate Consumer Welfare Directly • Key techniques: Online Choice Experiments and Lotteries • Single Binary Discrete Choice Experiments • Becker-DeGroot-Marschak Lotteries • Best-Worst Scaling • Both with and without incentive compatibility • At Massive scale
Key Findings • Choice experiments generate plausible demand curves • Valuations are consistent across BDM lotteries, best-worst scaling and SBDC experiments • Incentive compatible experiments often imply higher valuations • Median valuations • Search > email > maps > video > e-commerce > social media > messaging > music • Consumer surplus from Facebook in USA: • $450/year for median consumer • This approach could be scaled up to numerous goods and services
Discrete Choice Experiments • Common in marketing, transportation, price-setting, damages calculations, etc. • Widely used in industry for new product introductions and pricings • Accepted as evidence in legal cases • BP oil spill (Carson, List et al, Science 2017) • Samsung vs. Apple (Hauser vs McFadden), etc. • Three variants • Single Binary Discrete Choice Experiments • Best-worst scaling • Becker-DeGroot-Marschak (BDM) lotteries • Each can be done with or without incentive compatibility
Our Platforms for Choice Experiments • Lab in a University • Includes incentive compatible studies (where we enforce choices) • N = 500 • Professional Survey Panel (Research Now) • 3 million active verified panelists, user quotas selected to represent internet users in US, good for longer surveys (BWS) • N = 5000 • Google Consumer Surveys • Market research platform, good for short surveys (SBDC) • N = 200,000
Single Binary Discrete Choice (SBDC) Experiments • Ask consumers to make a single choice among two options: • Keeping the good • Give up the good and receive $Win return • Prices $W systematically varied between consumers • Seek to reduce error by increasing quantity of responses • Aggregation of data leads to demand curves • Can be done with or without incentive compatible design
Incentive Compatible SBDC Experiments • Randomly pick some respondents and fulfill their selection • E.g. for Facebook • If user chose to keep Facebook, do nothing • If user chose to give up Facebook, then • Ask them to give it up for 1 month • After 1 month, verify whether they have used Facebook in the past month and reward them with $W • This can be done remotely: Facebook reports when user was last online • Random application to 1 in 200 users suffices for Incentive compatibility
Facebook study with Incentive Compatibility n2016 = 1497, n2017 = 1388 Median WTA: • Heterogeneity in valuation • Higher valuations for people with • More time spent on Facebook • More friends they have • More frequent posting • More videos watched • Female • Older • Less use of Instagram or Youtube
Incentive Compatible Lab Studies Facebook, Instagram, Snapchat, Skype, WhatsApp, LinkedIn, Twitter, mobile Maps • ~ 600 subjects in Netherlands • 1/50 chance to get selected
Some Implied Demand Curves and WTA Wikipedia: WTAmedian = $150/year
Most widely used categories of digital goods Search Email Maps Video
Most widely used categories of digital goods Social Media E-Commerce Messaging Music
Non-digital goods: Breakfast Cereal WTAmedian = $48.46/year [$42.01, $55.60] Implied Consumer Surplus = $15 billion Compare: US Cereal Revenue = $10 billion
Another approach: Best-Worst Scaling vs. E-Commerce Music Streaming No Maps + Earn same as now Maps + Earn $100 less/ year vs.
Another approach: Best-Worst Scaling • Earn $10 less /yr • Earn $100 less /yr • Earn $500 less /yr • Earn $1000 less /yr • Earn $5000 less /yr • Earn $10,000 less /yr • Facebook • Twitter • Instagram • LinkedIn • Skype • Snapchat • Uber • WhatsApp • Wikipedia • Toilets at home • TV • Meeting friends in person • Breakfast cereal • Airline Travel • Public Transport • All Internet • Smartphone • Email • Search Engines • E-Commerce • Music • Video • Social Media • Maps
BWS Results: Disutility from losing access to goods for 1 year
What about inferring welfare changes for normal goods with prices? • In theory, changes in GDP would be equivalent to changes in welfare for goods with prices. • However this requires that proper quality adjustment is done • In practice, really hard to do quality adjustments, especially for tech products which are improving constantly
Quality adjustments in smartphones • Smartphones substituted • Camera • Alarm Clock • Music Player • Calculator • Computer • Land Line • Game Machine • Movie Player • Recording Device • Video Camera • Plus: • Data plan • GPS Map and directions • Web Browser • E-book reader • Fitness monitor • Instant messaging
Example: Smartphones and Cameras Ref: Varian 2017 • Photos taken worldwide • 2000: 80 billion photos • 2015: 1.6 trillion photos [20 times as many] • Price per photo has gone from 50 cents to 0 cents. • Increase doesn’t show up in GDP measures since... • Price index for photography includes price of (film, developing, cameras) all of which are vanishing • Photos are mostly shared, not sold (non-monetary transaction) • GDP went down when cameras were absorbed into smartphones
Importance of adjusting for quality changes:The case of smartphone cameras CPI for telephones fell to 91.06 in 2017 relative to 100 in base year 1997 Incentive compatible study measuring value created by smartphone cameras (front and back)
Smartphone camera lab study N = 200 BDM Lottery Median WTA/month = €68.13 (95%-CI = [€33.53; €136.78]) Cost to manufacture smartphone cameras = $20-$35 Cost to buy just the smartphone camera (modular phone) = €70
with Erik Brynjolfsson, Erwin Diewert, Felix Eggers, Kevin Fox Integrating GDP growth accounting for new and free goods The digital economy, GDP and consumer welfare: theory and evidence
The digital economy, GDP and consumer welfare: theory and evidence Develop a new framework for measuring welfare change • This is the foundation for a new measure we call GDP-B • An extension of traditional GDP • Derive an explicit term for the welfare change from new goods • Welfare change is mismeasured if this term is omitted by statistical agencies • Derive a lower bound for the addition to real GDP growth from a new good • Further extend the theory allowing free goods • Directly estimate consumer welfare by running massive online choice experiments • Apply techniques developed by Brynjolfsson, Collis and Eggers (2018)
The digital economy, GDP and consumer welfare: theory and evidence GDP-B = QF + (γp00* p01)q01/[γp0q0 (1+PF)] + [2γw0(z1 z0) + (w1 γw0)(z1 z0) + 2γw01z01] /[γp0q0 (1+PF)] + (γw00* w01)z01/[γp0q0 (1+PF)] where the highlighted term is the contribution from new free goods. This will be our focus in what follows.
GDP-B Contributions for Different Reservation Prices of Facebook
Conclusion • GDP, developed in 1930s, remains the de facto metric of economic growth. • Conceptually, consumer surplus is a better metric of well-being. • Massive online choice experiments have the potential to reinvent and significantly supplement the measurement of economic welfare. • Can be used for goods whether they have zero price or positive price • Highly scalable • Can be run in near real time to track changes in well-being • This approach can be incorporated into the national accounts
References Brynjolfsson, Collis & Eggers (2018). Using Massive Online Choice Experiments to measure changes in Well-being. NBER Working Paper No. 24514. Brynjolfsson, Collis, Diewert, Eggers & Fox (2018). The digital economy, GDP and Consumer Welfare: Theory and Evidence. Working Paper.
More Information MIT Measuring the Economy Project www.MeasuringTheEconomy.org