Download
1 / 45
470 likes | 498 Vues
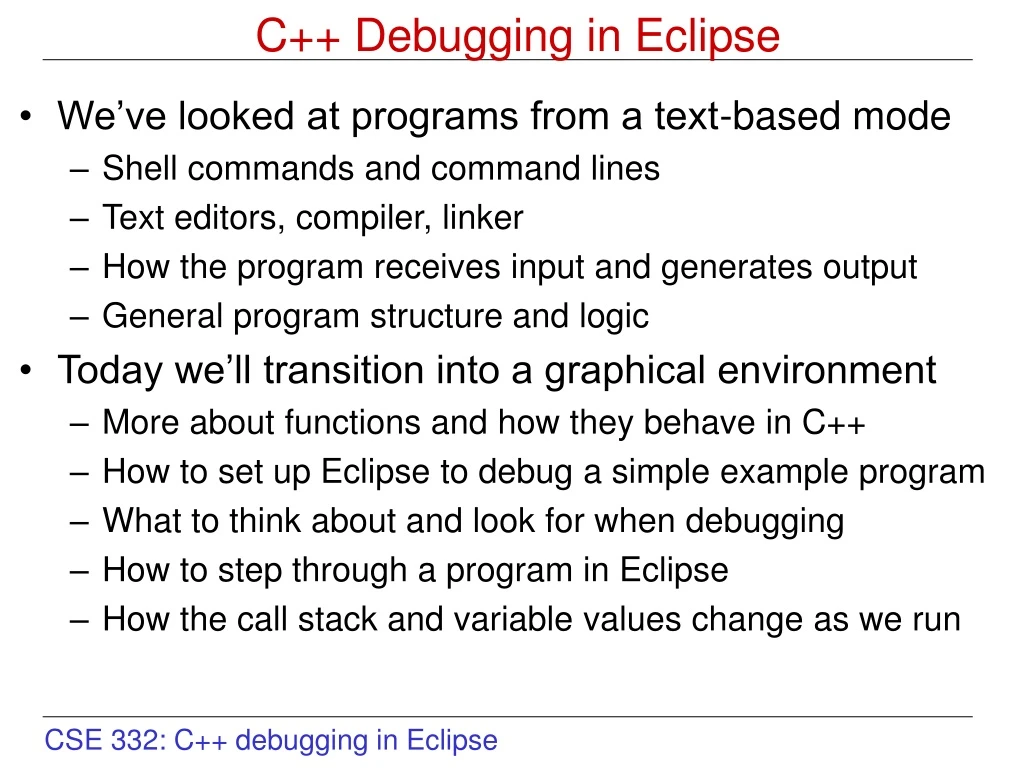
C++ Debugging in Eclipse. We’ve looked at programs from a text-based mode Shell commands and command lines Text editors, compiler, linker How the program receives input and generates output General program structure and logic Today we’ll transition into a graphical environment

E N D
C++ Debugging in Eclipse • We’ve looked at programs from a text-based mode • Shell commands and command lines • Text editors, compiler, linker • How the program receives input and generates output • General program structure and logic • Today we’ll transition into a graphical environment • More about functions and how they behave in C++ • How to set up Eclipse to debug a simple example program • What to think about and look for when debugging • How to step through a program in Eclipse • How the call stack and variable values change as we run
Getting Started • To set up your own environment for what we’ll cover • Log onto one of the CEC machines • Create a new directory (for example mkdir calculator) • Save files from course web page into that directory Makefile prefix_adder.h prefix_adder.cc • Now we’ll set up Eclipse to work with that code • Launching Eclipse • Setting up a project • How to step through a program in Eclipse • How the call stack and variable values change as we run
Launching Eclipse • On the Desktop • Click on the Red Hat • Select Programming • Select Eclipse • If you use another desktop environment in CEC lab • Should be similar • Ask CEC for help • Let me know if you have any problems
Creating an New Eclipse Project • When Eclipse starts, create a new project • Click on File menu • Click on New menu item • Select Project
Using Standard Makefiles in Eclipse • Select the Standard Make C++ Project wizard • That lets us use the kind of Makefile we’ve used so far • You can also use “Managed Make” but we won’t do that
Specifying an Existing Directory • Eclipse lets you specify an existing directory • Lets you find existing code • And bring it into an Eclipse project • Caveat: browse may hang in lab • Workaround: type in file path (pwd on command line)
Selecting an Existing Directory • Find and select the directory you want to use …
Naming the New Eclipse Project • … then fill in a name for the project
C/C++ Perspective in Eclipse • Click on Finish • Click Yes when the prompt appears • Uses the C/C++ perspective in Eclipse for the new project
Makefile Target “all” for Eclipse • Eclipse should now show the files in that directory • One Makefile change that may be needed sometimes • Eclipse expects a make target called “all” • Can just add a dependency on the executable
Setting up Project Configuration in Eclipse • Still need to set up a few more options • Click on Run menu • Select Debug…
Local Application Configuration in Eclipse • Select C/C++ Local Application • We won’t use the other C/C++ configurations right now • Attaching to a running program • Debugging a crashed program (Postmortem debugger) • Other options are for Java programs (may look familiar)
Setting up a New Debugging Configuration • Click on New button to set up a debug configuration • Should fill in default “main” values for the current project • Check/update/add names for the configuration, project, and application (the executable)
Filling in Command Line Arguments to Use • Click on Arguments tab and fill in program arguments • The rest of the command line after the program name • Can change these to run different tests of the program
Choosing the Debugger to Use in Eclipse • Click on Debugger tab and choose GDB Debugger • That’s the debugger we’ll use, others may be available
Adding Toolbar Items (Optional) • Click on Common tab to add to favorites menu • Can check Run and/or Debug boxes, then click Apply • Now you’re all set up: click Debug to run in debugger
Debugging an Example Program • Now we’ll use Eclipse to debug a program • Step through (and into) functions • Watching the call stack and variable values • But, before we start using the fancy tools… • What are we trying to achieve? • What do we expect our program to do? • How might our program fail? • Can we make predictions and test them? • Thinking: the most powerful way to debug • Scientific method should guide what you do • hypothesis, prediction, experiment, analysis • Eclipse can help you follow this disciplined approach faster
What the Example Program Does • Called with command line arguments ./prefix_adder + 8 + 9 10 • Calculates prefix addition expressions + 8 + 9 10 + + 8 9 10 • These are equivalent to their infix versions (8 + (9 + 10)) ((8 + 9) + 10) • Key idea: walk through expresion, calculate value same result different order 1 1 + + 2 3 2 5 8 + + 10 4 5 3 4 9 8 10 9
How the Example Program Can Fail • Too few arguments in expression ./prefix_adder + 8 + 9 • Cannot calculate result + 8 + 9 (needs another value to finish 2nd + operation) • Try this on your own in the lab, for practice 1 + 2 3 8 + 4 ??? 9
Example Program Header File // prefix_adder.h // // author: Chris Gill cdgill@cse.wustl.edu // // purpose: Declarations for a simple prefix adder program, which // takes the command line arguments as a prefix addition // expression and computes an integer result. #ifndef PREFIX_ADDER_H #define PREFIX_ADDER_H // Function prototypes. void usage (char * program_name); int parse_and_compute (int & current_index, int last_index, char *argv[]); #endif /* PREFIX_ADDER_H */
Example Program Source File // prefix_adder.cc // // author: Chris Gill cdgill@cse.wustl.edu // // purpose: definitions for a simple prefix adder program, which // takes the command line arguments as a prefix addition // expression and computes an integer result. #include "prefix_adder.h" #include <iostream> // For std output stream and manipulators. #include <string> // For standard C++ strings. #include <sstream> // For standard string streams. #include <cstring> // For C-style string functions // Helper function to print out the program's usage message. void usage (char * program_name) { cout << "Usage: " << program_name << " <argument> [<argument>]..." << endl << "Purpose: computes program arguments as prefix addition expression" << endl; }
Example Program Main Function int main (int argc, char *argv[]) { // A few useful constants for argument positions const int minimum_arguments = 2; const int starting_index = 1; const int program_name_index = 0; if (argc < minimum_arguments || strcmp (argv[starting_index], "--help") == 0) { usage (argv[program_name_index]); return 1; } try { // Pass the current and last index to use, and the array, to the // expression parsing function, and store the result. int current_position = starting_index; int value = parse_and_compute (current_position, argc - 1, argv); // Print out the result, and return success value. cout << "The value calculated is " << value << endl; return 0; } catch (...) { cout << "caught exception" << endl; return -1; } }
Example Program Parsing Function // Helper function to parse the input symbols and compute a value. int parse_and_compute (int & current_index, int last_index, char *argv[]) { // make sure we're still in the argument range if (current_index > last_index) { throw; } // look for a single-symbol addition operator if (strlen (argv[current_index]) == 1 && *(argv[current_index]) == '+') { int first_operand = parse_and_compute (++current_index, last_index, argv); int second_operand = parse_and_compute (current_index, last_index, argv); return first_operand + second_operand; } // treat anything else as an integer else { int result; istringstream i (argv[current_index++]); i >> result; return result; } }
Debugging our Example Program in Eclipse • When you click Debug (or use toolbar option) • Program loads with command line arguments you gave • Ready to run first statement in function “main”
Debugging Options in Eclipse • Click on Run menu to see options for debugging • Can click on menu items • Most have toolbar buttons too • Keyboard shortcuts are useful • Ctrl Shift B (toggle breakpoint) • F5 (step into a function) • F6 (step over a function) • F8 (resume exection)
Watching Variables and the Program Call Stack • Click on Variables tab • Shows what’s in scope • And shows values • Notice the call stack • Only has main initially • Will grow as other function calls are made
Tracing Through the Program Execution • Variables change • With scope changes • With assignments • Trace through program statements • Use F6 to step over • Use F5 to step into
Function Calls and Reference Variables • Reference variables • Old versions of Eclipse showed l-value (address) only (now shows both) • Can cast to r-value • Now we’ve stepped into a function call • Note code, call stack • Can jump stack frames
Eclipse Can Type Cast Watched Variables • Dialog shows default type of variable (int &)
Example of Casting from int & to int • Change type to int to view as an r-value
Values of Reference Variables in Expressions • Now you see the value of the aliased variable (instead of its address) • Makes it easier to think about what expressions it’s in should mean
Setting Breakpoints in Eclipse • Stepping through tells us a lot of information • But it soon gets tedious • Breakpoints tell program where to stop next • Can use menu, toolbar, or Ctrl Shift B shortcut • Toggles them on or off
Resuming Execution in Eclipse • Once we’ve set the breakpoint(s) we want • We can resume program execution • Can use menu, toolbar, or F8 shortcut • Runs to next breakpoint • Or to end of program
Example Program Execution in Eclipse • We’re parsing + + 8 9 10 • We’ve seen first + • Previous call to parse_and_compute • We’re on the second + • Hit F8 to resume • Stops in another nested call to parse_and_compute
Call Stack is Nested 4 Calls Deep • Still parsing + + 8 9 10 • We’ve seen + and + • Previous calls to parse_and_compute • We start at the 8 • Step (F6) through call • Notice result is 8 • Notice current_index now 4
Pop Back to Previous Function on Return • Return pops us back • Now in previous call to parse_and_compute (for second +) • Notice first_operand is 8 • Notice current_index is 4 • Hit F8 to resume run
Another Recursive Call is Pushed • Breaks in the new call pushed on the stack • Step to end again (F6) • Notice result is 9 • Notice current_index is 5 • Hit F6 (twice) to return
Back to Call at Depth 3 Again • Pops back again • Notice second_operand is 9 • Notice current_index is 5 • Hit F6 (twice) to return
Back at Original Call Made from Main • Pops back farther • Notice first_operand is 17 • Need to cast int & to int in each stack frame • Hit F5 to trace in of F8 to resume execution
One Last Push • Call is pushed on stack • Debugger stops • at start of call if we did F5 • at breakpoint if we did F8 • Trace from here using F6
Tracing Through One Last Time • Traced to end of the call • Notice result is 10 • Notice current_index > last_index • Hit F6 (twice) to return
Almost Finished • Back in original call made from main • Ready to return value of complete expression • Hit F6 (twice) to return
Ready to Print the Result • Back in main function • Ready to print value of complete expression • Hit F6 (once) to step over
That’s All, Folks • Ready to return 0 to indicate success • Notice program output • Hit F6 (twice) or F8 to finish
Exercise • Build and debug a damaged version of the program • Save another file from course web page into the directory bad_prefix_adder.cc • Update your Makefile to use that source file instead • Run make to build the new version of the program • Debug what’s wrong with the program (no fair using diff to detect code differences ;-) • Run the program with different inputs • Observe what happens (how does it go wrong?) • Trace through the program in Eclipse to narrow down the possible cause(s) of the probem(s) • Fix the error(s), rebuild, and re-run to observe its behavior