Download
1 / 1
20 likes | 292 Vues
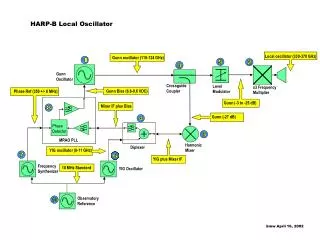
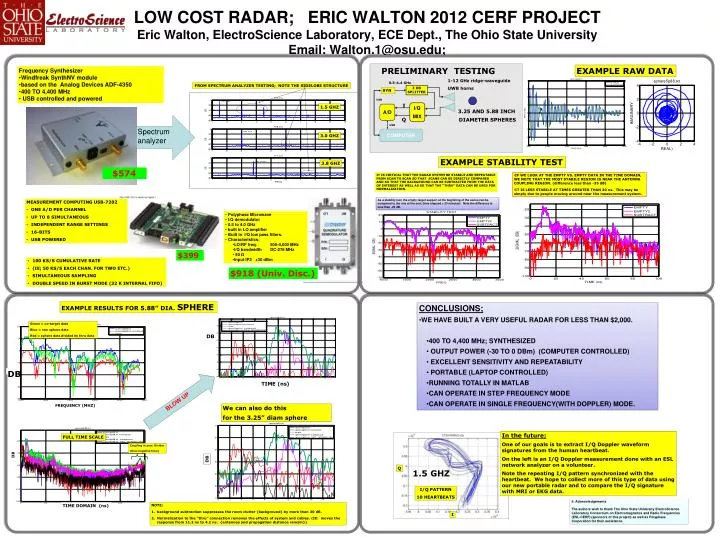
PRELIMINARY TESTING. EXAMPLE RAW DATA. Frequency Synthesizer Windfreak SynthNV module based on the Analog Devices ADF-4350 400 TO 4,400 MHz USB controlled and powered. 1-12 GHz ridge-waveguide UWB horns. 0.5-4.4 GHz. FROM SPECTRUM ANALYZER TESTING; NOTE THE SIDELOBE STRUCTURE.

E N D
PRELIMINARY TESTING EXAMPLE RAW DATA • Frequency Synthesizer • WindfreakSynthNV module • based on the Analog Devices ADF-4350 • 400 TO 4,400 MHz • USB controlled and powered 1-12 GHz ridge-waveguide UWB horns 0.5-4.4 GHz FROM SPECTRUM ANALYZER TESTING; NOTE THE SIDELOBE STRUCTURE 3 DB SPLITTER SYN USB I I/Q MIX 1.5 GHZ A/D 3.25 AND 5.88 INCH DIAMETER SPHERES Spectrum analyzer Q USB COMPUTER 3.0 GHZ EXAMPLE STABILITY TEST 3.8 GHZ $574 LOW COST RADAR; ERIC WALTON 2012 CERF PROJECTEric Walton, ElectroScience Laboratory, ECE Dept., The Ohio State UniversityEmail: Walton.1@osu.edu; IT IS CRITICAL THAT THE RADAR SYSTEM BE STABILE AND REPEATABLE FROM SCAN TO SCAN SO THAT SCANS CAN BE DIRECTLY COMPARED AND SO THAT THE BACKGROUND CAN BE SUBTRACTED FROM THE DATA OF INTEREST AS WELL AS SO THAT THE “THRU” DATA CAN BE USED FOR NORMALIZATION. • IF WE LOOK AT THE EMPTY VS. EMPTY DATA IN THE TIME DOMAIN, WE NOTE THAT THE MOST STABILE REGION IS NEAR THE ANTENNA COUPLING REGION. (difference less than -35 dB) • IT IS LESS STABILE AT TIMES GREATER THAN 20 ns. This may be simply due to people moving around near the measurement system. As a stability test, the empty target support at the beginning of the series can be compared to the one at the end; (time elapsed = 20 minutes) Note the difference is less than -25 dB. • MEASUREMENT COMPUTING USB-7202 • ONE A/D PER CHANNEL • UP TO 8 SIMULTANEOUS • INDEPENDENT RANGE SETTINGS • 16-BITS • USB POWERED • Polyphase Microwave • I/Q demodulator • 0.5 to 4.0 GHz • built in LO amplifier • Built in I/Q low pass filters. • Characteristics; • LO/RF freq. 500-4,000 MHz • I/Q bandwidth DC-275 MHz • 50 Ω • Input IP3 +30 dBm $399 • 100 KS/S CUMULATIVE RATE • (IE; 50 KS/S EACH CHAN. FOR TWO ETC.) • SIMULTANEOUS SAMPLING • DOUBLE SPEED IN BURST MODE (32 K INTERNAL FIFO) $918 (Univ. Disc.) EXAMPLE RESULTS FOR 5.88” DIA. SPHERE • CONCLUSIONS; • WE HAVE BUILT A VERY USEFUL RADAR FOR LESS THAN $2,000. • 400 TO 4,400 MHz; SYNTHESIZED • OUTPUT POWER (-30 TO 0 DBm) (COMPUTER CONTROLLED) • EXCELLENT SENSITIVITY AND REPEATABILITY • PORTABLE (LAPTOP CONTROLLED) • RUNNING TOTALLY IN MATLAB • CAN OPERATE IN STEP FREQUENCY MODE • CAN OPERATE IN SINGLE FREQUENCY(WITH DOPPLER) MODE. Green = no-target data Blue = raw sphere data Red = sphere data divided by thru data DB DB TIME (ns) BLOW UP FREQUENCY (MHZ) We can also do this for the 3.25” diam sphere In the future; One of our goals is to extract I/Q Doppler waveform signatures from the human heartbeat. On the left is an I/Q Doppler measurement done with an ESL network analyzer on a volunteer. Note the repeating I/Q pattern synchronized with the heartbeat. We hope to collect more of this type of data using our new portable radar and to compare the I/Q signature with MRI or EKG data. FULL TIME SCALE Coupling in pow. Divider (thus negative time) DB Q 1.5 GHZ I/Q PATTERN 10 HEARTBEATS 6. Acknowledgements The authors wish to thank The Ohio State University ElectroScience Laboratory Consortium on Electromagnetics and Radio Frequencies (ESL-CERF) (sponsors of this project) as well as Polyphase Corporation for their assistance. TIME DOMAIN (ns) NOTE; background subtraction suppresses the room clutter (background) by more than 30 dB. Normalization to the “thru” connection removes the effects of system and cables. (IE: moves the response from 11.2 ns to 4.2 ns. {antennas and propagation distance remain}) I