Download
1 / 47
470 likes | 555 Vues
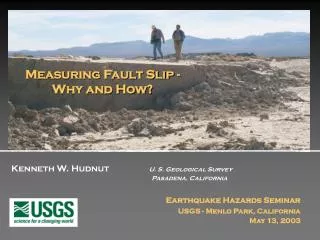
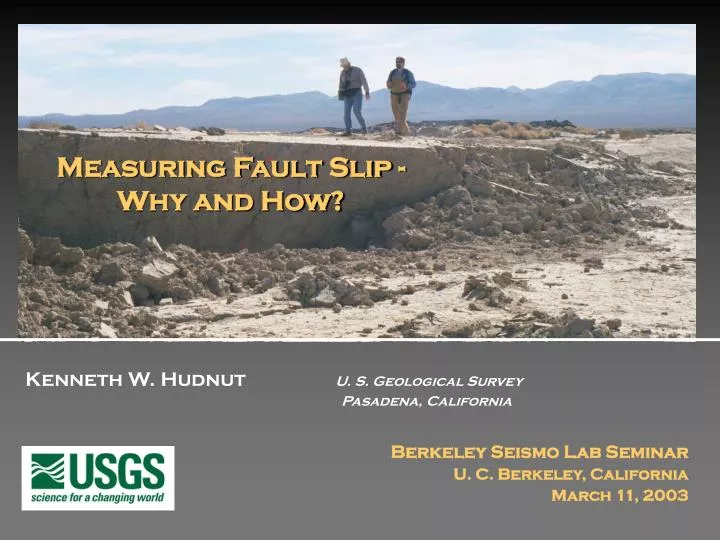
Measuring Fault Slip - Why and How?. Kenneth W. Hudnut U. S. Geological Survey Pasadena, California. Berkeley Seismo Lab Seminar U. C. Berkeley, California March 11, 2003. Measuring fault slip - why and how?. Why?

E N D
Measuring Fault Slip - Why and How? Kenneth W. Hudnut U. S. Geological Survey Pasadena, California Berkeley Seismo Lab Seminar U. C. Berkeley, California March 11, 2003
Measuring fault slip - why and how? • Why? • What can details of slip variation tell us about earthquake source physics? (You may suggest or prefer other reasons … ) • Variance and other statistical properties of slip distributions - physical relation to fundamental quantities (such as maximum slip, seismic and aseismic energy, stress drop, Dc) • Large slip variations, if real, could constrain rupture process models and explain high-frequency seismic energy radiation • How? (first, my bias is that great earthquakes do differ from small ones) • Attempt to observe slip pulses or other crack propagation phenomena • Real-time ‘GPS Fault Slip Sensor’ - to complement inertial sensors • Variation in slip along-strike and with depth - quantify the errors • Airborne Laser Swath Mapping - to observe near-fault deformation
earthquake scaling • Are stress drops constant? • e.g., Brune (1970, ‘71) • What about L-model scaling for large events? • e.g., Scholz (1982, 1994) and Romanowicz (1992) • Bi-linear scaling model • Hanks and Bakun (2002) • Great continental strike-slip earthquakes are of special interest - their slip (and stress drops) may become larger with longer ruptures (up to 10 x W): • 1857 and 1906 SAF • 1905 Bulnay and 1957 Gobi-Altay • 1920 Haiyun • 1939 Erzincan • Kunlun & Denali
some questions … • How may friction drop co-seismically? • Opening? What mode of crack propagation? • Key observation - accurate 3D particle motions close to the fault --- inertial sensors are unable to discriminate between tilt & acceleration; GPS fault slip sensors can help to observe this for future large events • What impedes and stops rupture? • Roughness and variation in slip - heterogeneity of stress, as well as fault interaction and dynamic effects • Key observation - objective systematic measurements of slip along-strike at surface for bedrock-on-bedrock fault with large amount of slip; ALSM for Hector Mine
GPS is now vital to earthquake monitoring(array technology and GPS satellites weredeveloped in Southern California) Measures buildup of strain on faults due to accumulating tectonic motion Used to detect damage to large engineered structures such as dams, and effects of ground tilt and subsidence on water systems Can be used in real-time to detect fault slip at surface, for early warning system
Science Review • List of publications - updates on the main project web page at http://www.scign.org/ • 45 papers from 1996 through April 2002 (includes several on Hector Mine co-seismic) - many important contributions that would have been impossible without SCIGN. • BSSA Hector Mine special issue (May, 2002) contains 16 papers (out of a total of 36) that made direct or indirect use of SCIGN data. Nearly all 36 then also cited these 16. • Fall AGU 2002 abstracts contain reports on several new projects using SCIGN data in innovative ways, as well as reports of the new results from the ongoing and coordinated SCIGN Analysis Committee effort, chaired by Nancy King. The use of continuous GPS data for various geophysical and other uses is increasing worldwide, and SCIGN has provided data used in a far wider range of studies than was ever imagined (e.g., Varner and Cannon, 2002). The open data policy has been a key to success. • SCIGN has become an integral part of what the broader SCEC community does in southern California. These results influence peoples’ thinking well outside of our regional scope, just as we all learn greatly from studies of other regions. Others see the value inherent in having a state-of-the-art array like SCIGN available (hence the PBO part of the EarthScope initiative). New data products are making SCIGN data more easily accessible to a larger and broader base of earthquake and other earth scientists.
SCIGN Data Products • 1st Year • Combined time • series (1996-2002) • 3rd Year • Real-time earth- • quake response • 5th Year • Resolve rates on • primary LA basin • faults (and others)
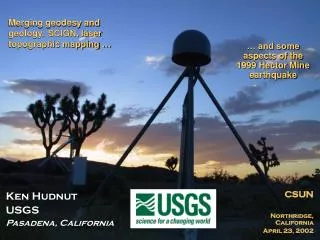
Earthquake response Hector Mine (Mw7.1) • rapidly assess the earthquake source Photo by Paul ‘Kip’ Otis-Diehl, USMC, 29 Palms
Damage estimation Pacoima Dam GPS structural health monitoring system(with LA County since Sept. 1995) • rapidly assess damage, casualties, and losses ShakeMap/HAZUS
GPS can help with… • Earthquake response information • Identify fault source, extent and amount of slip • Model finite fault source • Measure and model deformation field • Provide all of the above to the public, to emergency responders, and to other scientists • Damage estimation • Provide data for use in HAZUS, etc. • Support of remote sensing and positioning for accurate and timely collection, reporting and control of other data that require accurate position and/or timing • Monitor large engineered structures and lifeline systems • Basic positioning infrastructure
Central Computers Early Warning The speed of light >> the speed of sound EmergencyResponse Seismic and GPS Stations Utilities Transport- ation
Mitigative Actions Is 30 seconds of warning enough? • Stop trains • Stop nuclear reactions • Stop computers • Secure hazardous materials • Stop elevators
GPS Fault Slip Sensor APEC symposium Proc. Paper, Fall AGU poster, and paper in preparation for Bulletin of the Seismological Society of America http://pasadena.wr.usgs.gov/office/hudnut/slipsensor/ K. Hudnut, G. Anderson, A. Aspiotes, N. King, R. Moffitt, & K. Stark (all at USGS-SCIGN, Pasadena CA)
GPS Fault Slip Sensor is proposed to augment Earthquake Early Warning Systems what we cannot do…because the physical process is too chaoticweather – turbulenceearthquakes - friction • Recognize a precursor for a particular event • Differentiate readily between the beginning of a M3 and a M7 GPS ‘slip sensor’ can help with this! M3 M7
Lone Juniper Ranch and Frazier Park High School First prototype GPS fault slip sensor Spans the San Andreas fault near Gorman, California
Real-Time GPS Network - Enhancing SCIGN • On 15 November 2002, first-ever GPS fault slip sensor deployed across San Andreas fault at Gorman, Calif. • Upgrade SCIGN telemetry • DSL, frame relay • Radio repeaters, WiGate and dedicated links • Data buffering • Augment SCIGN real-time acquisition and processing system • Implemented sub-daily processing (4 hr) for ~100 SCIGN stations (down from 24 hr) • Implementing multiple real-time streaming GPS processors (commercial software)
The Plate Boundary Observatory Has been funded ! ($30M for FY03) • BARD & SCIGN are prototype deployments for PBO • PBO will extend the GPS & strain arrays throughout the Western U. S. A. and Alaska • With Canada and Mexico, we hope to cover the North American – Pacific plate boundary
before moving on … • State-of-the-art GPS networks and technology development have become vital infrastructure for earthquake research and response: • Static deformation field data; source models & rapid tilt and strain mapping • Monitoring of large engineered structures (e.g., dams, buildings) • Understanding earthquake source physics - e.g., slip pulses (near-field accurate particle motions and static displacement field mapping) • New enhancements to telemetry support wider range of applications • Real-time GPS sub-networks of SCIGN • Precise RTK positioning for surveying, AVL and GIS applications • InSAR, Airborne Laser Swath Mapping (ALSM) and digital photography • SCIGN provides ground control for airborne imaging and surveys • Mapping and imaging for rapid assessment of damage to buildings, lifeline infrastructure, etc. (The National Map; Homeland Security) • Collaboration between Scientific, Surveying, GIS, Engineering and Transportation communities has mutual benefits - this is expected to help with funding our projects in the future
Infrastructure for positioning ATC-20 building safety inspections(red, yellow and green tagging) • supports data collection and mapping during disaster recovery efforts imagery before & after Courtesy of Ron Eguchi Courtesy of City of Glendale
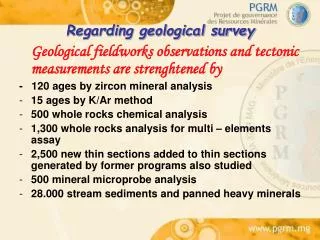
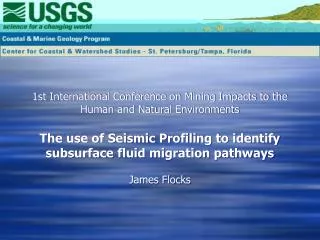
High resolution topography along surface rupture of the October 16, 1999 Hector Mine, California Earthquake (Mw7.1) from Airborne Laser Swath Mapping Hudnut, K. W. (USGS), A. Borsa (UCSD), C. Glennie (Aerotec, LLC) and J.-B. Minster (UCSD) Bulletin of the Seismological Society of America Special Issue on the Hector Mine earthquake (2002) http://pasadena.wr.usgs.gov/office/hudnut/docs/
ALSM, InSAR and TM imagingand mapping before & after Laser scan of land surfaces and urban infrastructure – buildings & lifelines - damage assessment ALSM – 9/11/01 NYC LANDSAT 7 & SRTM - damage in Bhuj, India Pre- and post-disaster images can be differenced to measure damage and track recovery
Active Faults in Southern California Hector Mine earthquake
Surface Rupture • Previously mapped, but un-named • Lavic Lake fault in recognition of breaks through dry lake bed • Up to 5.7 meters of right-lateral motion • 48 km overall length of surface rupture • Only ruptured once prior through ~50 ka alluvium from Treiman et al. (BSSA 2002)
ALSM (Scanning LIDAR imaging) • Slow, precise helicopter flight line data acquisition at 200-300 m AGL. • 6888 pps near infra-red (1064 nm) laser. • Scan Width: +/- 20 degrees. Nominally, 180 meters full-width. • 200 pulses across swath, ~ 80cm spacing. • Footprint Diameter: Nominally 40cm. • Half-meter posting, 15cm horizontal one-sigma absolute accuracy specified. • Integrated GPS & INS navigation and attitude determination. • Pitch Mirror Correction: maximum +3.5/-6.5 degrees (+ forward bias).
R v v r r R Geolocation Vectors and Error Sources Vector from CMearth to GPS phase center Magnitude & directional errors both are stochastic, time and location variant. Vector from GPS phase center to laser Magnitude error is constant if no airframe flexing. Directional error due to constant and time-varying biases in INS. Vector from laser to ground footprint Magnitude error due to timing, instrument and atmospheric delays. Directional error from constant mirror mounting offsets and time-varying biases in reporting of scan angles (both pitch and roll). Note: additional errors due to imperfect synchronization of GPS, INS, mirror scan and laser firing times must be modeled and removed as well.
Flight Plan • Two overlapping swaths • 200-500m mapped width • 70 km long • GPS network ≥ 1 Hz • Temporary GPS stations • Cross-swath spurs • Roll/Pitch/Yaw calibration maneuvers over dry lake • Flights over well-mapped Hector Mine
GPS Sites at ≥1Hz During ALSM Mission Calibration maneuvers at Hector Mine and Lavic Lake 1Hz 2Hz AGMT HCMN NBPS OPCL OPCX OPRD BMHL OPBL OPCP RDMT SIBE TROY
New methods to explore, new synergies between data types (e.g., GPS & ALSM) 1999 Hector Mine earthquake surface rupture • Combinations of seismic, geologic, and geodetic data in new ways • Source modelling • Hazard modelling • Cross-overs between fields • Geology and geodesy with InSAR and ALSM • Seismology and geodesy with high-rate GPS
ALSM-Derived Contours of Bullion Mountain Segment (blue lines are 1-foot contours)
To assess geodetic capability of repeat-pass ALSM:calibration requirements • Geometry: mount angles, scan offsets, GPS-Laser vector, GPS antenna phase center • Delays: electronic, optical, atmospheric • Reference point on laser platform • Timing of various components: e.g. INS vs. GPS vs. mirror attitude sensors • Stabilization platforms (delays, accuracy) • Detectors (thresholds, amplitude-range “walk”)
Exploded ordnance (crater) Lavic Lake Roll & Pitch Maneuvers pitch maneuvers
10 cm vert. 15 cm vert.
Geological quantification and questions • Tectonic interpretation of strain release in great earthquakes from their surface rupture • Basic documentation of surface rupture • e.g., Kurushin et al. (1997) study of 1957 Gobi-Altay eq. • How does slip vary along-strike? • e.g., need to assess variance and error in slip rate estimates from paleoseismic methods • e.g., Barka et al. (2002) and Rockwell et al. (2002) extensive studies of 1999 eq.’s in Turkey and similar studies of Hector Mine earthquake (BSSA 2002) • is high-frequency energy radiated from fault? • Does slip vary from one earthquake to the next? • can detailed topographic mapping of geomorphic features along the fault be modeled by repeats of exactly the same slip in successive earthquakes, or must slip vary in order to explain the topography? • slip variation models for earthquake recurrence strongly influence seismic hazard analyses – assumptions made in these analyses necessarily simplify faulting processes, with societal repurcussions
Southwest Corner of Lavic Lake dry lake bed for calibrations
New methods and data integration Airborne platform navigation must be highly precise and requires high-rate GPS data • precise topographic mapping of surface ruptures and active fault scarps • representation of actual fault ruptures recorded and preserved in unprecedented detail for use by future earthquake researchers
New methods and data integration • Precise topographic mapping of surface ruptures and active fault scarps • slip models for prehistoric events • rapid assessment of surface slip and damage patterns after large events • Requires precise integration of GPS & INS for flight navigation 1957 Gobi-Altai earthquake surface rupture
Conclusions - and some open questions • Airborne LIDAR imaging (ALSM) offers remarkable promise for geomorphology and fault zone studies, even over inaccessible or vegetated areas • Commercial operations are reliable and affordable on well-specified targets with carefully designed deployments (same as photogrammetry) • CAL-VAL maneuvers are essential for geodetic-quality mapping of geomorphic features • Turning ALSM into a geodetic-quality tool requires careful calibration and considerable analysis • Slip estimation: • has been initially developed demonstrated • new and improved methods are being developed • systematic measurement along the surface rupture will be done and then compared with geologic estimates, InSAR and other methods • quantitative assessment of slip variation along-strike • dynamic faulting models – is high-frequency energy radiating from the fault? • Quantitative geomorphology • Model tectonic landform evolution • Did topographic features form as a result of exactly repeated slip distributions? • Can topography be explained by only certain combinations of slip in past events? • Demonstrated GPS application to augment earthquake early warning systems • Understanding earthquake source physics - e.g., slip pulses & rupture mechanics • Near-field accurate 3D particle motions and static displacement field estimation