Download
1 / 68
700 likes | 884 Vues
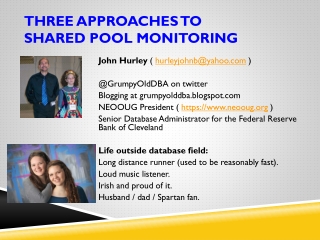
John Hurley ( hurleyjohnb@yahoo.com ) @ GrumpyOldDBA on twitter Blogging at grumpyolddba.blogspot.com NEOOUG President ( https://www.neooug.org ) Senior Database Administrator for the Federal Reserve Bank of Cleveland Life outside database field:

E N D
John Hurley ( hurleyjohnb@yahoo.com ) @GrumpyOldDBA on twitter Blogging at grumpyolddba.blogspot.com NEOOUG President ( https://www.neooug.org ) Senior Database Administrator for the Federal Reserve Bank of Cleveland Life outside database field: Long distance runner (used to be reasonably fast). Loud music listener. Irish and proud of it. Husband / dad / Spartan fan. THREE APPROACHES TO Shared Pool Monitoring
May 12-14 Cleveland State University Agenda: https://www.neooug.org/gloc/ • Shared Pool Overview and Background Information • Approach I using Oracle instrumentation • Approach II monitoring via custom scripting • Approach III SQL analysis • Case Study • References and Questions
SHARED POOL GROWTH BY RELEASE: Very common 11g systems: … shared pool 4/6/8+ gb First system I supported in production on hpux: Starting up ORACLE RDBMS Version: 7.3.2.1.0. shared_pool_size3500000 From the 7.3.4 init.ora (1998): shared_pool_size = 6000000# small:3.5M medium:6M large:9M
How many different SQL Statements? select round(bytes/(1024*1024),0) count, 'Shared Pool Size' info from v$sgainfo where name = 'Shared Pool Size'union all select count(*), ‘Unique sql statements' from v$sql_shared_cursor where child_number = 0union allselect count(*), ‘Same sql but not first copy' from v$sql_shared_cursor where child_number >= 1union allselect count(*), 'Total Execution plans' from v$sql_shared_cursorunion allselect count(*), 'Count from sqlarea' from v$sqlarea; 11.2.0.3 running Oracle eBusiness Suite 12.1.3
ORA 4031 vs ORA 4030 4031 aka “unable to allocate XXXX bytes of shared memory” 4030 aka “out of process memory” ? PGA oracle bug ? Bad PLSQL code
PGA items ( not in this presentation ): • PGA_AGGREGATE_TARGET 9i ( SORT_AREA_SIZE / HASH_AREA_SIZE ) • Auto management of PGA works well for most environments but BATCH processing and/or DW etl and/or special cases may need special attention and custom settings turning off the auto stuff. Underscore parameters can also be used to jury rig non default settings standard disclaimers apply. • PGA_AGGREGATE_LIMIT ( 12c be aware ? Set to zero ? ) • Looks like this may kill sessions off if limit is hit/exceeded • OPEN_CURSORS ( default value has changed over time 50 10.2? 300 default in 12c generally set much higher 900 / 2000 ? ) • SESSION_CACHED_CURSORS ( 20 in 10g / 50 in 12c )
Purpose of the Shared Pool • The shared pool was introduced as a feature of the Oracle database in version 7, primarily as a repository for Shared SQL and PL/SQL. • Since that time it has expanded and evolved to serve in its primary role for caching of cursors shared between sessions connected to the database. • At the most fundamental level, the shared pool is a metadata cache. While the buffer cache is used for the caching of data, the shared pool is used for caching complex objects describing where the data is stored, how it relates to other data and how it can be retrieved. • Much of the shared pool usage is to support the execution of shared SQL and PL/SQL packages; but in order to build a cursor or compile a PL/SQL procedure, we need to know all about the database objects referenced by the SQL or PL/SQL being compiled. • For example, in order to build a cursor for a simple select statement from a table, we need to know metadata about the table including column names, data types, indexes and optimizer statistics. All of this additional metadata is also cached in the shared pool, independent from the cursors or program units.
Shared pool basics • So what’s in your shared pool? • OCP answer: library cache, dictionary cache, and control structures. • Dictionary cache stores metadata ( data about tables and indexes etc ). • Library cache holds SQL and PLSQL plus executable forms of SQL cursors and PLSQL programs. Lots of views … v$sqlv$sqlareav$sql_planv$sql_shared_cursor etc. • Parent cursor includes text of sql statement and pointers to all the child cursors. Child cursor has execution plan. • Besides SQL there are a lot of different control structures and the larger an instance and the larger the session count is the more space used as overhead in the shared pool. • Categorization of space/stuff in the shared pool might best be done by looking at how oracle allocates it and names it.
SGA overview diagram An ORA-4031 error is raised when memory is unavailable for use or reuse in the System Global Area (SGA). The error message will indicate the memory pool getting errors and high level information about what kind of allocation failed and how much memory was unavailable. When an ORA-4031 error occurs, a trace file is created and noted in the alert log if the process experiencing the error is a background process. User processes may experience errors without reports in the alert log or traces generated.
04031, 00000, "unable to allocate %s bytes of shared memory (\"%s\",\"%s\",\"%s\,\"%s\")" • // *Cause: More shared memory is needed than was allocated in the shared pool. • // *Action: If the shared pool is out of memory, either use the • // dbms_shared_pool package to pin large packages, • // reduce your use of shared memory, or increase the amount of • // available shared memory by increasing the value of the • // INIT.ORA parameters "shared_pool_reserved_size" and • // "shared_pool_size". • // If the large pool is out of memory, increase the INIT.ORA • // parameter "large_pool_size". ORA-04031: unable to allocate 4120 bytes of shared memory ("shared pool","unknown object", "sga heap(1,0)","ASM extent pointer array")
SGA parameters and settings: Automatic memory management features ( love them or leave them ? ) 10g SGA_TARGET = 0 ( SGA autotuning is disabled ) SGA_MAX_SIZE Even if you set SGA_TARGET you can set “reserve” minimum sizes for: SHARED_POOL_SIZE, DB_CACHE_SIZE, LARGE_POOL_SIZE, JAVA_POOL_SIZE, STREAMS_POOL_SIZE You can also “manually resize” items if free space available up to SGA MAX. 11g MEMORY_TARGET / MEMORY_MAX_SIZE SHARED_POOL_SIZE SHARED_POOL_RESERVED_SIZE SHARED_POOL_MIN_ALLOC DBMS_SHARED_POOL.KEEP ( can PIN plsql code ) CURSOR_SHARING … ( if changing default consider trigger on AFTER LOGON ) SESSIONS/PROCESSES/TRANSACTIONS
from TanelPoder: Since Oracle 9.2 the shared pool can be “partitioned” into multiple parts. This was probably done for relieving shared pool latch contention for crappy applications (which use shared pool latches too much due to bad cursor or connection management). The “partitions” are called shared pool subpools and there can be up to 7 subpools. Each subpool is protected by a separate shared pool latch and each subpool has its own freelists and LRU list. There are a few different ways for detecting how many subpools you have in use. select count(distinct kghluidx) num_subpools from x$kghlu where kghlushrpool = 1; Oracle determines the number of needed subpools (during instance startup) based on your shared pool size and cpu_count. IIRC in 9.2 if you had 4 CPUs or more AND the shared_pool_size was bigger than 256 MB then 2 subpools were used, in 10g shared_pool_size had to be bigger for that, 512 MB I think and in 11g its 1GB. I don’t recall the exact threshold values and that’s not really important as you can see yourself how many subpools are in use with the above query. You can set the _kghdsidx_count variable to 7, this parameter can be used to force the number of subpools you want. In 9.2 days it was actually quite common to set this back to 1 IF you had ORA-4031 errors AND the reason was diagnosed to be free space imbalance between subpools. However since 10g this has been almost unnecessary as Oracle has improved their heap management algorithms. Web url: http://blog.tanelpoder.com/2009/06/04/ora-04031-errors-and-monitoring-shared-pool-subpool-memory-utilization-with-sgastatxsql/
Flow of storage allocation: Subpool 0 ( shared_pool_size ) Starts in subpool 0 until allocated … … flows out in Granules …………………………………………………………… Sub subpools known as durations … Many of the allocations here are in 1k/4k chunks … Number of other subpools varies depending on how many cpusetc… ORA-04031: unable to allocate 4120 bytes of shared memory ("shared pool","unknown object", "sga heap(1,0)","ASM extent pointer array") Subpool 1 sub 0 Subpool 1 sub 2 Subpool 1 Subpool 1 sub 1 Subpool 1 sub 3 Subpool2 ( maybe ) … Subpool7 ( last possible one )
Granules of SGA memory populate real working subpools over time
SHARED POOL MEMORY MGMT: • Some structures in shared pool seem to be static sized and “perm” ( event statistics per sess/ db_block_hash_buckets / FileOpenBlock ) others jump around in size dramatically. • Hit the Easy button: database buffer cache … each buffer is the same size … just need to know who to toss out? • Shared pool has unenviable job of having to support allocations of each and every arbitrary size 16 bytes up to 4000+ byte sizes … and try not to get “too fragmented” as memory is allocated then eventually voluntarily relinquished or forced to be given up when something else important needs space. • Jonathan Lewis chapter 7 in “Oracle Core Essential Internals for DBAs and Developers. • I used my substantial skills in Big Data / Hadoop / Map Reduce and created my own representation of how the memory allocations in the shared pool are managed.
NO SOUP FOR YOU!( How mANY SUBPOOLS for mE? ) • You may not need more than one subpool unless seeing latching problems/contention on shared pool latch. • Latch … lightweight locking mechanism for memory structures. • Can control/force number by underscore parameter …( be careful ). select count(distinct kghluidx) num_subpools from x$kghlu where kghlushrpool = 1; alter system set "_kghdsidx_count"=1 scope=spfile; *** Range of valid counts 1 to 7
approach I – built in MONITORING • Oracle views v$sgainfov$sgastat( v$shared_pool_advice ) • v$sgainfo looks similar to initparms • v$sgastat has details and specifics • History DBA_HIST_SGASTAT (by AWR snapid ) • V$DB_OBJECT_CACHE items in library cache • We will look at these queries: select * from v$sgainfo select * from v$sgastat order by bytes desc select * from v$sgastat where name like '%ASM%' order by bytes desc *** AWR reports have volumes of relevant information *** If using Oracle dynamic memory mgmt views like:v$sga_dynamic_components, v$sga_resize_ops …
KGH: NO ACCESS * * * * * * * * * * Buffer cache contents in the shared pool … Here more than 300+ mb from a 1 gb shared pool TanelPoder: KGH: NO ACCESS allocations in V$SGASTAT – buffer cache within shared pool! http://blog.tanelpoder.com/2009/09/09/kgh-no-access-allocations-in-vsgastat-buffer-cache-within-shared-pool/
select * from v$sgastatwhere name like '%ASM%' order by bytes desc*** Oracle USES many ASM related AREAS
select * from ( select row_number () over ( partition by namespace order by sharable_memdesc ) row_within, namespace, sharable_mem, substr(name, 1,40 ) short_name from v$db_object_cacheorder by sharable_memdesc ) where row_within <= 5 order by sharable_memdesc, namespace, row_within; References: Understanding Shared Pool Memory Structures ( Oracle White Paper Sept 2005) Library Cache Internals Julian Dyke 2006
11.2.0.3 system has different algorithm to count hits in session_cached_cursors 11.1.0.7
AWR sections on SQL … will get back to some of this in part 3
AWR sections on Dictionary Cache stats / Library Cache Statistics DBA_HIST_SGASTAT by snapid
VIEWS FOR DYNAMIC SGA SIZING OPERATIONS: V$SGA_RESIZE_OPS V$SGA_DYNAMIC_COMPONENTS V$SHARED_POOL_ADVICE V$DB_CACHE_ADVICE V$PGA_TARGET_ADVICE
12c introduces Complications • Multitenant CDB container database PDB pluggable database. • Get familiar with CON_ID column and its meaning for various values • http://www.pythian.com/blog/my-first-five-minutes-with-oracle-database-12c/ If THREE pluggable databases then 3 / 4 / 5 will be used for CON_IDs
12c from CDB: select * from v$sgastat order by 3 desc 0 = entire CDB 1 = root 2 = seed 3 = PDB1 ( 1st pluggable ) 4 = PDB2 ( 2nd pluggable) FROM PDB … may not be able to see outside your CON_ID and what you see varies: select * from v$db_object_cache where con_id <> 4 – NO ROWS select * from v$sgastat where con_id <> 4– ROWS RETURNED
select con_id, namespace, round(sum(sharable_mem)/(1024*1024),1) mb from v$db_object_cache group by con_id, namespace order by 3 desc 0 = entire CDB 1 = root 2 = seed 3 = PDB1 ( 1st pluggable ) 4 = PDB2 ( 2nd pluggable) FROM CDB FROM PDB2 (4) Depending on which instance you connect into in a CDB environment you may see more or less information. Plus accuracy is questionable at this point.
How to chew up the shared pool? • Flooding the database server with connection requests. • Flooding the database server with parse requests. Especially bad when apps are not using bind variables and new statements are added that differ only in literal values. • While soft parses are bad enough they are way better than hard parses. • Use CURSOR_SHARING FORCE? • Adjust SESSION_CACHED_CURSORS?
APPROACH II – Custom Monitoring Why use custom monitoring when built in monitoring has so much information available? • Compulsive Tuning Disorder? • Custom monitoring is way cool? • Get some special application SQL monitoring put in place along with more detail on shared pool memory allocations? • Do not trust CDB / PDB setup? • To know how many real subpools in use if more than one and how they are being used or misused. Oracle view v$sgastat aggregates allocations into totals for all real subpools … not showing detail within subpools. • You can control how long summary and detail information is retained outside of AWR retention periods. *** Are you using OSWatcher???
APPROACH II – SUMMARY INFORMATION CREATE TABLE MON_SHARED_POOL_ALLOC_SUMMARY ( MON_DATE DATE, SUBPOOL VARCHAR2(55), BYTES NUMBER, MB NUMBER) MON_DATE SUBPOOL BYTES MB 11/10/2010 12:55:02 PM shared pool (0 - Unused): 805306368 768 11/10/2010 12:55:02 PM shared pool (1): 2013281080 1920 11/10/2010 12:55:02 PM shared pool (Total): 2818587448 2688 MON_DATE SUBPOOL BYTES MB 11/10/2010 12:26:01 PM shared pool (0 - Unused): 2415919104 2304 11/10/2010 12:26:01 PM shared pool (1): 402664896 384 11/10/2010 12:26:01 PM shared pool (2): 402668464 384 11/10/2010 12:26:01 PM shared pool (Total): 3221252464 3072
Monitoring the shared pool detail CREATE TABLE MON_SHARED_POOL_ALLOC_DETAIL( MON_DATE DATE, SUBPOOL VARCHAR2(55 BYTE), CON_ID NUMBER, /* 12c */ NAME VARCHAR2(26 BYTE), SUM_BYTES NUMBER, MB NUMBER)
MON_DATE SUBPOOL NAME SUM_BYTES MB 11/10/2010 shared pool (0 - Unused): free memory 805306368 768 11/10/2010 shared pool (1): sql area 593555600 566 11/10/2010 shared pool (1): free memory 249993560 238 11/10/2010 shared pool (1): CCursor 12990376 203 11/10/2010 shared pool (1): private strands 82396160 78 11/10/2010 shared pool (1): kgsp-heap 67354488 64 11/10/2010 shared pool (1): event statistics per sess 62889120 59 11/10/2010 shared pool (1): sessions 61039448 58 11/10/2010 shared pool (1): PCursor 60461752 57 11/10/2010 shared pool (1): db_block_hash_buckets 46665728 44 11/10/2010 shared pool (1): KTI-UNDO 42611360 40 11/10/2010 shared pool (1): dbktb: trace buffer 40960000 39 11/10/2010 shared pool (1): KGL handle 36514888 34 11/10/2010 shared pool (1): PL/SQL DIANA 32112536 30 11/10/2010 shared pool (1): KGLS heap 28062936 26 11/10/2010 shared pool (1): PL/SQL MPCODE 25861152 24 11/10/2010 shared pool (1): Heap0: KGL 20787080 19 11/10/2010 shared pool (1): procs: ksunfy 20480000 19 11/10/2010 shared pool (1): VIRTUAL CIRCUITS 17881056 17 11/10/2010 shared pool (1): parameter table block 17598208 16 11/10/2010 shared pool (1): KQR L PO 15233256 14 11/10/2010 shared pool (1): transaction 15062520 14 11/10/2010 shared pool (1): XDB Schema Cac 13992472 13 11/10/2010 shared pool (1): enqueue 13747368 13 11/10/2010 shared pool (1): KQR M PO 10986504 10
MON_DATE SUBPOOL NAME SUM_BYTES MB 11/12/2010 shared pool (0 - Unused): free memory 503316480 480 11/12/2010 shared pool (1): sql area 833387864 794 11/12/2010 shared pool (1): free memory 274810016 262 11/12/2010 shared pool (1): CCursor 262065240 249 11/12/2010 shared pool (1): private strands 82396160 78 11/12/2010 shared pool (1): PCursor 80625328 76 11/12/2010 shared pool (1): event statistics per sess 62889120 59 11/12/2010 shared pool (1): sessions 61039448 58 11/12/2010 shared pool (1): db_block_hash_buckets 46665728 44 11/12/2010 shared pool (1): KGL handle 46110424 43 11/12/2010 shared pool (1): KTI-UNDO 42611360 40 11/12/2010 shared pool (1): dbktb: trace buffer 40960000 39 11/12/2010 shared pool (1): PL/SQL DIANA 32389168 30 11/12/2010 shared pool (1): KGLS heap 26861512 25 11/12/2010 shared pool (1): PL/SQL MPCODE 26027192 24 11/12/2010 shared pool (1): Heap0: KGL 23295632 22 11/12/2010 shared pool (1): procs: ksunfy 20480000 19 11/12/2010 shared pool (1): VIRTUAL CIRCUITS 17881056 17 11/12/2010 shared pool (1): kgsp-heap 17847632 17 11/12/2010 shared pool (1): KQR L PO 17714656 16 11/12/2010 shared pool (1): transaction 15062520 14 11/12/2010 shared pool (1): XDB Schema Cac 13992472 13 11/12/2010 shared pool (1): enqueue 13747368 13 11/12/2010 shared pool (1): KQR M SO 12376896 11
MON_DATE SUBPOOL NAME SUM_BYTES MB 11/12/2010 shared pool (0 - Unused): free memory 2315255808 2208 ... 11/12/2010 shared pool (1): sql area 177543520 169 11/12/2010 shared pool (1): free memory 40800856 38 11/12/2010 shared pool (1): CCursor 31556632 30 11/12/2010 shared pool (1): PCursor 17688320 16 11/12/2010 shared pool (1): dbktb: trace buffer 16105472 15 11/12/2010 shared pool (1): KGL handle 12078368 11 11/12/2010 shared pool (1): PL/SQL DIANA 10824024 10 11/12/2010 shared pool (1): PL/SQL MPCODE 9438128 9 11/12/2010 shared pool (1): ASH buffers 8388608 8 11/12/2010 shared pool (1): private strands 8307712 7 ... 11/12/2010 shared pool (2): sql area 171903960 163 11/12/2010 shared pool (2): free memory 43248480 41 11/12/2010 shared pool (2): CCursor 29699472 28 11/12/2010 shared pool (2): PCursor 17107160 16 11/12/2010 shared pool (2): db_block_hash_buckets16777216 16 11/12/2010 shared pool (2): dbktb: trace buffer 16105472 15 11/12/2010 shared pool (2): PL/SQL DIANA 11971816 11 11/12/2010 shared pool (2): KGL handle 11905328 11 11/12/2010 shared pool (2): FileOpenBlock 11479640 10 *** sgastat will not show detail within subpools
select mon_date, subpool, name, mb from dbaperf.mon_shared_pool_alloc_detail where ( name like 'sql%' or name like '%Cursor%')order by mon_date desc, mb desc, subpool
12c custom monitoring One pluggable database can chew up shared pool and take away space from other PDBs attempting to run in the container.
Where or where has my little PCURSOR/CCURSOR GONE? Some kind of reference to KGLH0 / HD replacing PCursor/CCursor from 11.1 to 11.2 and on … ??? KGLH0 is/was PCursor maybe ??? KGLHD is/was CCursor maybe
Heapdumps and other potentially dangerous queries … Heapdumping and various querying can lock the memory areas or hold latches. Please use with caution if at all on a busy system. You should really get familiar with some of these techniques on a test system. Julian Dyke … http://www.juliandyke.com/Diagnostics/Dumps/Dumps.html Jonathan Lewis Core Internals • $ sqlplus / as sysdba • SQL*Plus: Release 11.1.0.7.0 - Production on Mon Nov 22 11:08:05 2010 • SQL> alter session set events 'immediate trace name heapdump level 2050'; This took over 6 minutes on an almost idle system ( almost 3 gig of shared pool and 8 gig SGA ). ( Done on clone of production on replicated storage ). -rw-r----- 1 oracle oinstall 2939057287 Nov 22 11:14 prod_ora_16526.trc Can also be done with “oradebug dump heapdump 2050”.
****************************************************** HEAP DUMP heap name="sga heap(1,0)" desc=0x60049e00 extent sz=0xfe0 alt=216 het=32767 rec=9 flg=-126 opc=0 parent=(nil) owner=(nil) nex=(nil) xsz=0x2000000 heap=(nil) fl2=0x20, nex=(nil) latch set 1 of 1 durations disabled for this heap reserved granules for root 48 (granule size 33554432) EXTENT 0 addr=0x298000000 Chunk 298000058 sz= 48 R-freeable "reserved stoppe" Dump of memory from 0x0000000298000058 to 0x0000000298000088 298000050 00000031 08B38F00 [1.......] 298000060 00000000 00000000 089F5D00 00000000 [.........]......] 298000070 60051830 00000000 9A000070 00000002 [0..`....p.......] 298000080 41F0F1CD 00000000 [...A....] Chunk 298000088 sz= 3358536 R-free " " Dump of memory from 0x0000000298000088 to 0x0000000298333FD0 298000080 00333F49 C8B38F00 [I?3.....] 298000090 98000058 00000002 60051D88 00000000 [X..........`....] 2980000A0 9A000098 00000002 00000000 00000000 [................] 2980000B0 00000000 00000000 00000000 00000000 [................] Repeat 209905 times
Diagnosing shared pool memory problems • Doc IDs 1088239.1 / 369940.1 / 146599.1 • Out of memory ( v$sgastat history … DBA_HIST_SGASTAT ). • Unbalanced subpool usage ( X$KSMSS … TanelPoder script sgastatx.sql ). • Shared pool fragmentation • X$KSMLRU ( TP script ksmlru.sql ) • Check for excessive hard parsing ( TP script snapper ). • Shared pool heapdumps ( very dangerous ) • X$KSMSP ( potentially dangerous )
Diagnosing shared pool memory problems*** SYSTEM WILL PROBABLY NOT BE USEABLE FOR EXTENDED PERIODS OF TIME … DANGEROUS. alter system set event="4031 trace name heapdump level 536870914" scope=spfile; alter system set events '4031 trace name errorstack level 3: 4031 trace name HEAPDUMP level 2 ‘ ( scope=spfile|memory|both); alter system set events '4031 trace name HEAPDUMP off '; Examples above from internet … may or may not actually be correct. Validate on test system if even thinking about potentially using.
Useful but potentially dangerous queries ( latching ) X$ tables: • X$KSMSS ( what type of storage is used and how much is allocated ) ( my monitoring scripts access this so does TanelPoderssgastatx ). • X$KSMLRU ( good for identifying shared pool troublemakers ) • X$KSMSP ( shared pool heaps ) • X$KSMSPR ( shared pool reserved heaps ) • X$KSMSP ( valuable for diagnosing 4031s and detecting fragmentation but some people have noted problems so caveat emptor ).
select ksmchcom, sum(ksmchsiz), count(*), avg(ksmchsiz) from x$ksmspgroup by ksmchcom order by 2 desc