Download
1 / 26
290 likes | 546 Vues
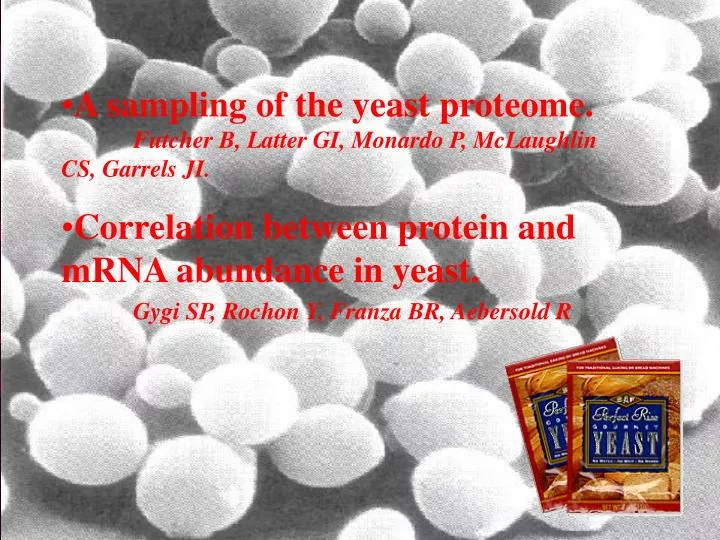
Yeast. A sampling of the yeast proteome. Futcher B, Latter GI, Monardo P, McLaughlin CS, Garrels JI. Correlation between protein and mRNA abundance in yeast. Gygi SP, Rochon Y, Franza BR, Aebersold R. Objectives. Gather quantitative data for protein abundance.

E N D
Yeast • A sampling of the yeast proteome. Futcher B, Latter GI, Monardo P, McLaughlin CS, Garrels JI. • Correlation between protein and mRNA abundance in yeast.Gygi SP, Rochon Y, Franza BR, Aebersold R
Objectives • Gather quantitative data for protein abundance. => Create database for yeast proteins. • Correlation between mRNA level to corresponding proteins level. • Correlation between codon bias* and protein levels. • Protein expression patterns under various environmental conditions (i.e. ethanol/glucose).
Motivation why claculate mRNA and protein correlation? • Quantitative analysis of global mRNA levelscurrently is a preferred method for the analysis of the stateof cells and tissues. mRNA level <= ? => protein level • Several methods which either provideabsolute mRNA abundance or relative mRNA levels incomparative analyses are easy to apply. * Fast * Very Sensitive
Why Yeast? • Low complexity(relative lack of introns), perfect for lab work, unicellular, well understood physiology, etc.. • The genome of the yeast was sequenced. • The number of mRNA molecules for each expressed gene was recently (1999) measured. (SAGE*) • Codon bias tables are well known. * SAGE – Serial Analysis of Gene Expression
SAGE* – mRNA frequency tables. • Generating a single unique sequence tag (15 bp) of each mRNA’s 3’-most cutting site for NlaIII of the Yeast Cell. • Concatenation into a single molecule andthen sequencing, revealing the identity of multiple tags simultaneously. • Computer software was used to calculate mRNA abundance, and creating the frequency tables. a 1.3-fold coverage even for mRNA molecules presentat a single copy per cell. (a 72% probabilityof detecting single copy transcripts) * 20,000 transcripts were made. * Estimated 15,000 mRNA molecules per cell. * SAGE – Serial Analysis of Gene Expression
Codon bias • Definition: A given codon is used more (less) often to code for an amino acid over different other codons fot the same a.a. • Highly biased mRNAs may use only 25 of the 61 codons. • Different ways to measure C.B exist. • Thelarger the codon bias value, the smaller the number of codonsthat are used to encode the protein.
Codon bias - continued • Use of these codons may make translation faster or more efficientand may decrease misincorporation. • Codon bias is thought to be an indicator of protein expression, with highly expressed proteins having large codon bias values.
Experiment Synopsis • Label all Proteins with [35S] methionines & cysteines (pulse). • wait . . .X min (chase). • Separate Proteins via: - Centrifugation - 2D Gels • Identify (various MS methods and more) • Quantify Protein Amounts. (use radioactivity) phosphorimaging, scintillation counting, autoradiography.
Results present new problems • 1400 spots were visualized (1200 proteins). 3.1 <pI < 12.8 ; 10kDa < Mr < 470kDa • Problem: One gel => poor resolution. Think McFly, Think… • Solution: Use 3 different gels with different pH ranges. • Problem: Comigration & coverage – weak spots can be seen only when they are well separated from strong spots. • No real solution yet.
Results • 169 spots representing 148 proteins were identified using: peptide sequencing, MS , amino acid composition and gene overexpression. • Pulse-chase experiments were made to determine protein turnover (half lives). => all spotted proteins are very stable proteins.
Results – protein quantitation • Effectively same half life. => radioactivity is proportional to protein abundance. • The number of methionine and cysteine per identified protein is known. => the number of protein molecules can be calculated.
Results – some numbers • Protein abundance range of 300 fold (!). • Less than a 100 proteins account for half of the total cellular protein.
Correlation of protein abundance with mRNA abundance • mRNA abundance • SAGE. • hybridization of cRNA to oligonucleotide arrays. • Both methods give broadly similar results. • An adjusted mRNA ratio was calculated combining the two. • Elaborate correlation statistics were made. (Don’t Worry, I will not elaborate today… )
Correlation of protein abundance with adjusted mRNA abundance. • Spearman rank correlation coefficient, rs,was 0.74 (P < 0.0001). • Pearson correlation coefficient,rp, on log transformed data was 0.76 (P< 0.00001). • A 10-fold range of protein abundance, f or mRNAs of a given abundance. (why?)
Correlation of codon bias with protein abundance • The rs for CAI versus protein abundance is 0.80 (P <0.0001). (astrong correlation) • When some abundant proteins were removed from consideration, The rs was essential unchanged.
Changes in protein abundance on glucose and Ethanol were quantified as well. Gluconeogenesis enzymes more abundant on ethanol. Heat shock proteins more abundant on ethanol. Protein synthesis enzymes were more abundant onglucose. Phosphorylation of proteins. And more. Additionl experiments.
Discussion - numbers • 1200 proteins were quantified. 1/3 – 1/4 of total proteins expressed. • 148 IDed. others can be IDed using gene overexpression. But There is always a (_|_) … • The remaining proteinswill be difficult to see and study with these methods. (weak spotsare covered by strongspots).
2nd research - Correlation between protein and mRNA abundance in yeast. • Similar experiments were made by Gygi et al. • Similar methods (MS) were used to identify 156 proteins (products of 128 genes). • Correlation Analysis between mRNA and codon bias to protein abundance levels were made. • Genes with missing data were excluded. • no SAGE data. • ambiguous tags. • no Met’s. • comigration. • pI did not match Mr. 106 genes
Codon bias to protein Correlation. • No genes were identifiedwith codon bias values less than 0.1 even though thousands ofgenes exist in this category. something’s fishy!? who said bias?
rp = 0.35 inner set: mRNA protein correlation total: rp = 0.93 Lets take a closer look…
including progressively more, and higher-abundance, proteinsin each calculation
Codon bias, an indicator of the boundaries of current 2D gel proteome analysis technology. A promising approach is the use of narrow-rangefocusing gels. Current proteome technology is incapableof analyzing low-abundance regulatory proteins without employingan enrichment method. For highereukaryotes the detection of low-abundance proteins wouldbe even harder. Discussion - conclusions
Discussion – words of the wise. Gygi et al: “This study revealed that transcript levelsprovide little predictive value with respect to the extent ofproteinexpression.” Futcher et al: “there is a good correlation between protein abundance and mRNAabundance for the proteins that we have studied”.
Codon Bias. Long half lives. Low abundance proteins were not found. (T.Fs, kinases etc.) SAGE data. Met’s processed away. Comigration. Discussion – biases • Different statistical manipulations.
Why Proteomics – revised • quantity of large scale protein expression. • the subcellularlocation. • the state of modification. • the association withligands. • the rate of change with time of such properties. • GO HOME !