Download
1 / 40
400 likes | 474 Vues
POWERING EV GROWTH IN SANTA DELANO VALLEY. The Technology & Policy Group Ash Bharatkumar , Michael Craig, Dan Cross-Call, & Michael Davidson Prepared for the USAEE Case Competition 2013 Anchorage, AK, July 29. Outline. Summary of challenge EV and demand growth projections

E N D
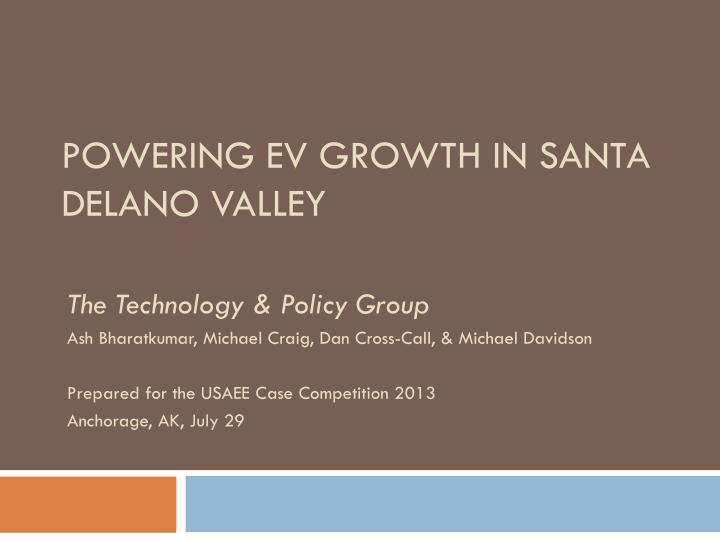
POWERING EV GROWTH IN SANTA DELANO VALLEY The Technology & Policy Group Ash Bharatkumar, Michael Craig, Dan Cross-Call, & Michael Davidson Prepared for the USAEE Case Competition 2013 Anchorage, AK, July 29
Outline • Summary of challenge • EV and demand growth projections • BAU: Transmission and distribution expansion • Alternatives • Energy storage • Demand response • Controlled charging • Tariff design for equitable allocation of EV costs Technology & Policy Group
The Challenge • Growth in electric vehicles (EVs) poses challenges for Santa Delano Electric Company (SDEC) • Accommodate new electricity load • Maintain affordable and reliable electricity • Ensure equitable distribution system upgrade costs • While encouraging growth in EV ownership • Options and opportunities for a 15 year planning horizon Tesla Roadster Technology & Policy Group Nissan Leaf Images: thecarconnection.com and proetools.com
Electric Vehicle Projections • Projected growth with Bass diffusion model • Used elsewhere to model EV growth • Low, medium and high growth scenarios • Split fleet projections proportionally into EV models 30% Fleet Penetration, 2027 10% 1%
BAU: T&D Expansion • Distribution and transmission network expansion required to serve increased demand from EVs over 15 year horizon • Distribution expansion for each 1% increase in load relative to 2012 load • Increase substation capacity (transformers + feeders) • Transmission expansion for each 5% increase in load relative to 2012 load • Add lines Technology & Policy Group
BAU: T&D Expansion Costs *Note: Costs will vary with network topology, terrain, selected line voltage, distance of transmission, and reactive power profile of load Technology & Policy Group
BAU: T&D Expansion – Findings • T&D network build-out can accommodate projected EV growth • Medium Growth cost: $1,460 per EV • Not the recommended course of action Technology & Policy Group
Summary of Alternatives • Energy storage • Energy storage is not a viable option • Costlier than T&D upgrades, not suitably mature • Demand response • Real time prices are not reliable alternative to T&D upgrades • Controlled charging • Controlled charging is preferred solution to accommodate EVs Technology & Policy Group
Alternative 1: Energy Storage • Meet additional peak load from EVs with many small installations on distribution network • Shifts electricity from off-peak to peak hours • Limited technologies are viable for distributed applications • Sodium-sulfur (NaS) batteries – commercially available, chosen as a representative battery chemistry • Modeled build-out per annual power and energy needs Technology & Policy Group
Alternative 1: Energy Storage –NaS Installations (7 MWh/1 MW) Technology & Policy Group
Alternative 1: Energy Storage – Findings • Costs much more than T&D upgrades • Medium Growth: $5,133 per EV • Not suitably mature for near-term application • Energy storage is not a viable option Technology & Policy Group
Alternative 2: Demand Response • Engage households in reducing peak load through tariffs that vary with system conditions • SDEC pilot used locational marginal price (LMP) • Peak demand will be shifted only if: • Size of price incentive is sufficiently large (>5x) • Households are open and responsive to price signals • Price reflects peak system demand
Alternative 2: Demand Response – Analysis of Pilot • Weak price incentive: only 10 hours with large differential • Low opt-in rate (24%) • Wide variation/unpredictability in customer response
Alternative 2: Demand Response – Disadvantages of LMPs • LMP reflects mostly California wholesale prices: Congestion < 10% of LMP cost in CAISO in 2012 • SDEC peak does not align with LMP peak:
Alternative 2: Demand Response – Findings SDEC’s DR pilot using real-time prices (RTP) led to small, inconsistent reductions in peak demand The standard price signal – locational marginal price – does not accurately reflect distribution-level congestion RTP is not reliable alternative to T&D upgrades
Alternative 3: Controlled Charging • Two options considered: • Utility has full control over charging • Delayed charging (4 hours after plug in) • Shift EV loads to off-peak hours • But at the expense of consumer control Technology & Policy Group
Alternative 3: Controlled Charging – Model • Modeled load-shifting capability with GAMS • Cost-minimization optimization • Assumed 90% EV fleet participation • Guaranteed all EVs fully charge overnight • Minimized total system cost (demand times price) Technology & Policy Group
Alternative 3: Controlled Charging – Load Shifting No Control, Medium EV Growth Scenario
Alternative 3: Controlled Charging – Load Shifting Controlled Charging, Medium EV Growth Scenario, 90% of EVs
Alternative 3: Controlled Charging – Costs • Costs of program: • Smart meters • IT and communications infrastructure • Annual IT costs • Annual savings from less “dumb” meter reading • T&D upgrades from EVs not in program Costs for Medium Growth Scenario Technology & Policy Group
Alternative 3: Controlled Charging – Findings • Off-peak night hours can fully absorb demand from EVs under all growth scenarios • Costs less than T&D upgrades • Medium Growth: $125 per EV • Preferred solution to accommodate EVs Technology & Policy Group
Tariff Structure – Essential Considerations • Goals of differentiated tariffs: • Pursue lowest total system cost • Allocate costs of system upgrades equitably (avoid cross-subsidization) • Demand (capacity) charges more precise than energy charges from T&D perspective • Controlled charging infrastructure (e.g., smart meters) furthers other SDEC objectives Technology & Policy Group
Tariff Structure - Recommendations Monthly EV charger fee of $8, effective for 15 years (approx. cost per EV of BAU T&D upgrades) Fee waived if enrolled in controlled charging program Program participants face higher rate when override charging schedule Smart meters paid for by rate base Periodically review tariff (e.g., every 2 years) to ensure accurate cost accounting
Conclusion • Large but uncertain demand growth expected from EVs • Ideally accommodate load cost-effectively and equitably while encouraging further EV growth • BAU T&D expansion costly • Of alternatives, only controlled charging accommodates load at reasonable cost • Proposed tariff allocates cost equitably Technology & Policy Group
Thank You for Your AttentionQuestions? Technology & Policy Group
Bass Diffusion Model • Three key parameters (low, medium and high): • Maximum potential market (m=0.03, 0.25, 0.7) • Fraction of purchasers who make decisions independent of others and network externalities (“coefficient of innovation”) (p=0.01, 0.015, 0.02) • Fraction of purchasers who are swayed by decisions of others and network effects (“coefficient of imitation”) (q=0.3, 0.35, 0.4) Technology & Policy Group
Proportions of EV Types in Fleet Technology & Policy Group
Demand Growth Projection Details • Split fleet projections proportionally into EV types • Accounted for: • Fraction of EVs that plug in during peak hours at home • Temporal distribution of when EVs plug in • Charger level (Level 2 for EVs >40kWh) • Daily travel distance (high value (52 mi.) for EVs >40kWh) • Duration of charge Technology & Policy Group
Demand Growth Projection Details Technology & Policy Group
Temporal Distribution of Added Demand Technology & Policy Group
Controlled Charging Model Formulation • Cost minimization: • z = total cost, p(h) = price, B(h) = base demand, D(h) = aggregate EV demand, h = hour, v = vehicle • Must fully charge overnight: • C(v,h) = charging, d(v) = hours required for full charge • Charging and plug-in relationship: • L(v,h) = plugs in
Controlled Charging Model Formulation • Charge status: • C(v,h) = charging, L(v,h) = plug-in, U(v,h) = unplug • Demand from EVs: • D(h) = aggregate EV demand, P(v) = charging power • Limit number of EVs that plug-in per hour: • M = max number of EVs that can plug-in per hour Technology & Policy Group
T&D Expansion Costs Technology & Policy Group
T&D Expansion • Transmission expansion – add lines • Line loadability governed by St. Clair Curve – line loadability vs. line length • Capacity of shorter lines limited by conductor thermal capacity, longer lines governed by SIL and voltage stability limits Technology & Policy Group
LMP Variation During Pilot Period • Only 10 hours during six months with LMP above five times average of $85 / MWh Technology & Policy Group
DR Household Response Technology & Policy Group