Download
1 / 48
480 likes | 606 Vues
Comparative Validation of Innovative Capping Technologies Anacostia River, Washington DC. Presented by Danny D. Reible Chevron Professor and Director Hazardous Substance Research Center/South & Southwest Louisiana State University 19 February 2003. Hazardous Substance Research Center.

E N D
Comparative Validation of Innovative Capping TechnologiesAnacostia River, Washington DC Presented by Danny D. Reible Chevron Professor and Director Hazardous Substance Research Center/South & Southwest Louisiana State University 19 February 2003
Hazardous Substance Research Center South and Southwest • Established under CERCLA (Recompeted 2001) • Mission • Research and Technology Transfer • Engineering management ofcontaminated sediments • Primarily focused on in situ processes and risk management • Unique regional (4&6) hazardous substance problems • Outreach • Primarily regional in scope • Driven by community interests and problems LSU Georgia Tech Texas A&M Rice
Selecting Remedial Options • NAS Committee On PCB Contaminated Sediments • Recommended framework of Presidential and Congressional Commission on Risk Assessment and Management • Key points • Manage the risks not simply surrogates of risk like concentration or mass • Engage stakeholders early and often
Sediment Management • Risk controlled by relatively small well defined areas (hot spots) in dynamic sediment environment with defined on-shore disposal options? • Encourages removal options • Risk defined by diffuse contamination in stable sediment environment? • Encourages in situ management options • What about other sites? • Requires site specific assessment and conceptual model development • There are no default options; site specific assessment necessary!
In Situ Capping - Advantages • Armors sediment for containment • Can be designed to be stable in high flow conditions • High confidence in describing dynamics of noncohesive, granular media • Eliminates uncertainty of existing sediment dynamics • Separates contaminants from benthic organisms • Eliminates bioturbation (primary source of exposure and risk in stable sediments) • Typical flux reduction at steady state by factor of 1000 • Reduces diffusive/advective flux • Increased transport path and sorption-related retardation • Time to achieve steady state may be thousands of years • Provides opportunities for habitat development
Cap Effectiveness • Replaces particle transport processes with porewater processes • Elimination of erosion and bioturbation as transport processes • Diffusion (always present) • Advection if seepage significant (highly variable) • Reduces steady state contaminant flux • Additional reduction in transient in flux • Reduces migration during transient consolidation of sediment and cap materials • Reduces transient migration through cap • Partition coefficient, Ksw (Organics- Ksw ~ focKoc ) • Rf = e + rb Ksw
Terrebonne Bay, LA January 31, 2001 2 cm 6 cm A7
Steady State Cap Performance • Diffusion dominated system • Flux prior to capping • NA/rbWs ~ 1 cm/yr (without erosion) • Flux after capping • NA/ rbWs ~ Dcap/Leff Rf • For pyrene, 1 ft cap - .001 cm/yr (Rf~ O[103]) • Advection dominated system • Typically only small portions of sediment bed • Flux after capping ultimately approaches prior flux • Sediment concentrations are dependent upon sorptive capacity of capping material • Sand - low steady state concentrations near cap-water interface
Overlying Water Cap Consolidation Dhcap hbio Bioturbation Layer h0 Cap Layer hcap Dhsed/Rf Sediment Consolidation Dhsed
Cap Design Factors - Stability • Top layer stability • Design velocity or stresses (e.g. 100 year flood) • d50(ft) = 1/4 tc (lb/ft2) (Highway Research Board) • Non-uniform size distribution • d85/d15 > 4 • Angular shape • Maximum particle size <2 d50 • Minimum particle size > 0.05 d50 • Thickness > 1.5 d50 • Adjacent layers:d50 ( layer 1) / d50 (layer 2) < 20 • Especially important for armored caps or caps using coarse grained material for habitat enhancement to avoid washout of finer material • Transition zone length: 5 times cap thickness
Current Issues in Cap Design • Optimal placement over very soft sediments • Placement of fine-grained, heterogeneous materials • Chemical containment • NAPL seeps • Gas generation and migration • Methyl mercury formation and migration • Design and effectiveness with groundwater seepage • Assessment of seepage (and variation with time/space) • Control of seepage • Stability • Selection of design flow, prediction of resulting stresses • Stability of innovative cap materials • Active Caps – Caps as a reactive barrier
Capping Concerns • Contaminants are not removed or eliminated • Residual risk of cap loss • But all remedial measures leave residual risk • Intergenerational stewardship a “fact of life” for any contaminated sediment site of any complexity • Can caps be designed to ensure • Migrating contaminants are eliminated? • Residual pool of contaminants degrade over time? • Continuing sources can recontaminate cap • Continuing sources a problem for any remedial approach • Can caps be designed to reduce recontamination?
Comparative Evaluation Metrics • Primary metric – Risk • Secondary metrics • Link to appropriate conceptual model of system • Indicator species concentrations (e.g. fish) • Contaminant mass (dynamic environment) • Surficial average concentrations (stable environment) • When risk due to diffuse contamination (not “hot spots”) • SWAC – surface area weighted average concentration • Integral measures (allows incorporation of time)
Fox River, Reible et al. (2003) 25% Breach – 28 ppm-yr 5% Breach – 19 ppm-yr No Cap Breach – 16 ppm-yr A14
Summary – Conventional Capping • Conventional sand caps easy to place and effective • Contain sediment • Retard contaminant migration • Physically separate organisms from contamination • Methods are available for key design needs • Cap erosion and washout • Cap and sediment consolidation • Chemical containment • Assessment of exposure and risk
Active CappingCan you Teach an Old Dog New Tricks? Danny D. Reible Hazardous Substance Research Center/S&SW Louisiana State University
Potential of Active Caps • Sand caps easy to place and effective • Contain sediment • Retard contaminant migration • Physically separate organisms from contamination • Greater effectiveness possible with “active” caps • Encourage fate processes such as sequestration or degradation of contaminants beneath cap • Discourage recontamination of cap • Encourage degradation to eliminate negative consequences of subsequent cap loss
Active Capping Demonstration Project • The comparative effectiveness of traditional and innovative capping methods relative to control areas needs to be demonstrated and validated under realistic, well documented, in-situ, conditions at contaminated sediment sites • Better technical understanding of controlling parameters • Technical guidance for proper remedy selection and approaches • Broader scientific, regulatory and public acceptance of innovative approaches
Overall Project Scope A grid of capping cells will be established at a well characterized contaminated sediment site: • Contaminant behavior before capping will be assessed • Various capping types will be deployed within the grid evaluating placement approaches and implementation effectiveness • Caps will be monitored for chemical isolation, fate processes and physical stability • Cap types and controls will be compared for effectiveness at achieving goals
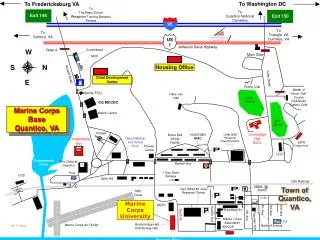
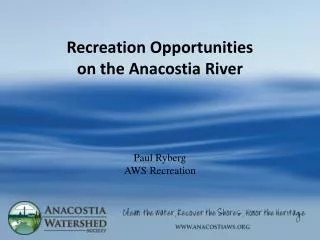
Demonstration Site – Anacostia River • Anacostia River has documented areas of sediment contamination • Anacostia Watershed Toxics Alliance (AWTA) offers unique opportunities • Ultimate rehabilitation approaches uncertain • Much of current focus on reducing contribution of sources • Areas adjacent to Navy Yard are good candidate sites based on review of existing data
Demonstration Participants • Lead • Danny Reible, Hazardous Substance Research Center • Louisiana State University • Prime Contractor • Horne Engineering, Fairfax, VA • Yue Wei Zhu, Lead Engineer • SITE program evaluation of Aquablok • Vincente Gallardo, EPA Cincinnati • Advisory Groups • Anacostia Watershed Toxics Alliance • Remediation Technology Development Forum
Demonstration Site– Anacostia River • Two potential study areas identified adjacent to Navy Yard • First site has elevated PCBs and metals [1] • Second site is primarily PAHs [2] • Some seepage, free phase at depth at second site Washington DC Tidal Basin 2 1
Proposed Demonstration Area • The proposed demonstration areas are approximately 200 ft by 500 ft (approximately 2 acres) adjacent the shoreline upstream and downstream of the Navy Yard • Each proposed pilot study cell is approximately 100 ft by 100 ft in size and two or three study cells per area will be implemented.
Demonstration Sites • First Site – old CSO outfall • South end of Navy Yard • PCBs: 6-12 ppm • PAHs: 30 ppm • Metals • Cd: 3-6 ppm Pb: 351-409 ppm • Cr: 120-155 ppm Hg: 1.2-1.4 ppm • Cu: 127-207 ppm Zn: 512-587 ppm • Second site – near old manufactured gas plant • North end of Navy Yard • PAHs up to 210 ppm
Potential Cap Technologies • Six technologies undergoing bench scale testing and evaluation • Bench scale testing objectives • Problems with physical placement? • Problems with contaminant or nutrient release during placement? • Problems with effectiveness with Anacostia contaminants? • What is appropriate cap design, homogeneous or layered composite? • What are key physical or chemical indicators of performance? • Placement approaches also under evaluation • Gravity tremie placement • Layered placement • Needlepunched mats (CETCO)
Potential Cap Technologies • Aquablok • Control of seepage and advective contaminant transport • Focus of EPA SITE Assessment • Zero-valent iron • Encourages dechlorination and metal reduction • With or without sequestering amendments to retard migration • Phosphate mineral (Apatite) • Encourages sorption and reaction of metals • Coke • Encourages sorption-related retardation • BionSoil • Encourage degradation of organic contaminants • Natural organic sorbent • Encourages sorption-related retardation
AquaBlokTM • Gravel/rock core covered by clay layer • Expands in water decreasing permeability • Applicable to seep locations (Site 2) • May be useful as funnel in “funnel and gate” reactive barrier design • Semi-commercial technology • Treatability evaluation underway Hull & Assoc
Zero-Valent Iron • Fe(0), Fe-S, Pd/Fe(0) under consideration • Subject to cathodic reactions that yield hydrogen • Hydrogen can drive reductive biotic transformations • Reductive dechlorination • Metal reduction • Directly provide electrons for abiotic reduction • Chlorinated Organic Compounds (PCBs) • Evaluation underway by Carnegie Mellon University • Metals • Evaluation underway by Rice University
Coke Sorbent • Coke Breeze • 92% fixed carbon • 140 mm particles with 45-50% porosity • Particle density of 1.9-2 g/cm3 • TCLP leachate – contaminants below detection limit • Treatability testing underway at Carnegie Mellon University
Apatite Barrier Apatites – Ca5(PO4)3OH • Subject to isomorphic substitution • Pb5(PO4)3OH • Cd5(PO4)3OH • Reduces migration of metal species • Employing XRF and XAS for metal species dynamics and migration • Evaluation underway with LSU/University of New Hampshire
BionSoilTM • Manufactured soil from composting • Hydrogen source • Enhancement of reductive dechlorination • Enhancement of anaerobic degradation of PAHs • High organic content • Encourages sorption and retardation of transport • Evaluation underway at LSU
OrganoClay Sorbent • Candidate - Biomin EC-100 organo-modified clay • Low permeability • High organic content • Encourages retention of both non-aqueous and dissolved constituents • Evaluated for control of active hydrocarbon seeps in Thea Foss Waterway, WA • Treatability testing underway with Hart-Crowser
Other Potential Cap Materials • Ambersorb commercial sorbent • Effective sorbent but high cost • Activated carbon sorbents • Effective sorbent intermediate in cost • Primary focus on coke as cheaper (but less effective carbon-based adsorbent)
Capping Demonstration Schedule • Technology Evaluations (Initial Phase) – Jun/Dec 2002 • Studies currently ongoing at LSU and collaborating institutions • Site Characterization – Jan-Apr 2003 • Phase 1 Geophysical Investigation (Jan 2003) • Phase 2 Geotechnical and Chemical Assessment (Feb 2003) • Phase 3 Biological Assessment (Apr 2003) • Cap Design – Jan/Jun 2003 • Cap Placement (Site 1) – Jul/Aug 2003 • Cap Evaluation – Aug 2003/Sept 2004
Site Characterization Objectives • Establish the contamination baseline at demonstration areas • Define contaminant variability • Identify and confirm appropriate areas for cap demonstration • Determine the geotechnical characteristics of the sediment • Provide necessary baseline data for future evaluation of effectiveness of capping placement and capping technologies
Site Characterization • Preliminary physical assessment (Ocean Survey & R. Diaz) • Bathymetry measurement • Side scan and sub-bottom profiling • Sediment profiling camera • Surficial sediment sample collection • Sediment coring sample collection • Sediment radionuclide characterization • Historical deposition • Average rate and extent of bioturbation • Geotechnical data for the cap design • Historical Data Collection (groundwater seepage, flow velocity, and etc.) • Biological Assessment (type and density)
Site 1 A38
Site 2 A39
Site 1 – Typical Conditions • Sandy, oxidized surface • Gas voids A40
Site 2 • Similar to Site 1in some areas • More organic and more mobile surface layer in other areas A41
Site 2 – Disturbed area • Oxidized • Easily disturbed surface A42
Chemical Sampling • Surficial sediments • ~40 surficial sediment samples will be collected from each site four (4) inch and up to six (6) inch thick at each grid point using a stainless steel Van Veen grab sampler or Petite Ponar grab sampler. • Core sediments • 8 cores will be collected from each site to a depth of 3 ft • Samples collected from 0-6”, 6”-12” and 12”-36” • Additional deeper cores will be used to assess underlying stratigraphy and provide geotechnical information for design • One water sample from underlying sand unit • Additional shallow cores (gravity corer) employed to supplement baseline sampling • Water sampling • To define chemical baseline in water and potential for recontamination of caps
Geotechnical Parameters Note: * One value of permeability must be calculated from the self-weight consolidation test. ** Use the Modified standard consolidation test and self-weight consolidation test as described in USACE 1987 (Department of Army Laboratory Soils Manual EM 1110-2-1906 -USACE 1970).
Monitoring Cap Effectiveness • Employ cores and dialysis samplers to define placement and cap effectiveness • Bottom of core – undisturbed sediment • Middle of core – cap/sediment interface • Examine interlayer mixing • Examine contaminant migration/fate processes • Top of core – cap/water interface • Examine recontamination • Examine recolonization • Supplement with physical monitoring • Water column (flow, suspended sediment and chemical) • Non-invasive (sonar, bathymetry) • Invasive (sediment profiling camera)
Summary • Capping technologies undergoing bench-scale evaluation and testing • Site characterization efforts currently underway • Site 1 placement planned for summer 03 • Aquablok • Zero valent iron/coke breeze • Apatite • Additional information www.hsrc-ssw.org