Download
1 / 43
430 likes | 576 Vues
Assessing and Enhancing Critical Thinking Skills in the Laboratory and Science/Engineering Classroom. Matt Grayson, Josh Leonard, & Denise Drane. Support for this work was provided by the National Science Foundation’s TUES Program: grant 942404 . Overarching Questions.

E N D
Assessing and Enhancing Critical Thinking Skills in the Laboratory and Science/Engineering Classroom Matt Grayson, Josh Leonard, & Denise Drane Support for this work was provided by the National Science Foundation’s TUES Program: grant 942404.
Overarching Questions • What is critical thinking? • What does it look like in science and engineering? • How we can we assess it? • How can we promote it?
Session Overview • Describe NSF funded study on critical thinking • Reflect on experience of being in the study • Review a way of defining critical thinking • Review assessments of critical thinking • Design a critical thinking assessment • Review ways of promoting critical thinking
Study Design Summer 2010 Fall 2010 Summer 2011 Fall 2011 How much does student’s critical thinking usually improve? Faculty teach as usual Students take tests at beginning and end of the quarter What is critical thinking? How can you measure it? How do you teach to improve critical thinking? Can we increase gains in critical thinking by changing teaching? Faculty teach with new methods Students take tests at beginning and end of quarter
Critical Thinking Skills Evaluation of Information Creative Thinking Learning & Problem Solving Communication
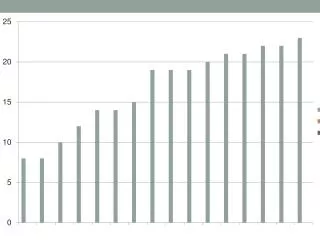
Summarize the information presented in Figure 1 Some scientists believe that the prevalence of autism is increasing. To what extent do the data in Figure 1 support the scientists’ beliefs?
3. Are there other possible explanations for the data in Figure 1 that would not necessarily support the idea that the prevalence of autism is increasing in the US? Explain
4. What types of additional information would be necessary to more fully evaluate the scientists’ hypothesis the prevalence of autism has increased in the US between 1980 and 2010? Try to identify three types of additional information and explain how each would help evaluate the scientists’ hypothesis.
Critical Thinking Skills • Separate factual information from inferences. • Interpret numerical relationships in graphs. • Understand the limitations of correlational data. • Identify alternative interpretations for data or observations. • Identify new information that might support or contradict a hypothesis.
Design a wallet using this piece of paper. 2. List 3 factors that would lead you to change the design of the wallet. Describe how you would alter your design in direct response to a change in each factor?
Explain how new information can change a problem. • Communication
Critical thinking assessment questions in Chemical and biological engineering & Electrical Engineering
Chem. Eng. 341: “Dynamics & Control of Chemical and Biological Processes” • Course themes: mathematical analysis of processes that change in time, strategies for controlling process dynamics • Pedagogical goal: improve students’ ability to utilize and draw appropriate conclusions from empirical data • Students:~30 senior ChE undergrads and a few MS Source: Joshua Leonard, ChE 341 2012 & 2013
Designing assessment questions: critical thinking skills targeted • Summarize the pattern of results in a graph without making inappropriate inferences • Evaluate how strongly correlation-type data supports a hypothesis • Evaluate whether spurious information strongly supports a hypothesis • Identify additional information needed to evaluate a hypothesis
Example : Summarize the pattern of results in a graph without making inappropriate inferences A control engineer is working in a chemical plant in which it has been determined that an existing chemical reactor must be outfitted with a new control scheme in order to keep the concentration of product produced by that reactor (CP) within desired limits. The engineer hypothesized that it should be possible to modulate the product concentration by adjusting the rate at which the feed enters the reactor (F). In order to program the controller, the engineer must derive an equation that relates the quantities F and CP. Therefore, the engineer performed an experiment in which F was adjusted to a particular value and held constant for 1 hour, then CP was measured, and then F was adjusted to a new value, and so on in order to obtain the data plotted below (i.e., 6 such measurements were made).
Example : Summarize the pattern of results in a graph without making inappropriate inferences A control engineer is working in a chemical plant in which it has been determined that an existing chemical reactor must be outfitted with a new control scheme in order to keep the concentration of product produced by that reactor (CP) within desired limits. The engineer hypothesized that it should be possible to modulate the product concentration by adjusting the rate at which the feed enters the reactor (F). In order to program the controller, the engineer must derive an equation that relates the quantities F and CP. Therefore, the engineer performed an experiment in which F was adjusted to a particular value and held constant for 1 hour, then CP was measured, and then F was adjusted to a new value, and so on in order to obtain the data plotted below (i.e., 6 such measurements were made).
Example : Summarize the pattern of results in a graph without making inappropriate inferences 1. Summarize the information presented in Figure 1 above Criterion 1: Can they can read the graph? Criterion 2: Were inappropriate inferences made?
EECS 384: “Solid State Electronic Devices” • Course themes: relating electronic materials properties to device operation • Pedagogical goal: improve students’ ability to work in groups and to solve critical thinking problems • Students:~12 senior EECS undergrads and junior grads
SECTION I. Mark is a well-respected scientist in an industrial research laboratory who has invented a new processing technique which he argues can make useful electronic devices out of any thin layer of plastic polymer. The data shown below were taken from two samples processed on different days with completely different polymers that he has processed with the same technique. Both graphs were published in highly respected journals. However, no other scientists in the field have been able to reproduce these results, in spite of several years of attempts. Nancy is a colleague from a competing institution who has raised the question that this scientist may have falsified his data.
SECTION I. Mark is a well-respected scientist in an industrial research laboratory who has invented a new processing technique which he argues can make useful electronic devices out of any thin layer of plastic polymer. The data shown below were taken from two samples processed on different days with completely different polymers that he has processed with the same technique. Both graphs were published in highly respected journals. However, no other scientists in the field have been able to reproduce these results, in spite of several years of attempts. Nancy is a colleague from a competing institution who has raised the question that this scientist may have falsified his data.
1) What do you see in this data that may have contributed to Nancy’s suspicions of falcification? ONE POINT EACH (UP TO 3 POINTS MAX) IF STUDENT MENTIONS THE FOLLOWING: * Data curves look remarkably similar, virtually indistinguishable * Values of voltage labels for curves are identical (-1V through -10V) * Values of axes are the same except for a negative sign • EXAMPLES OF INCORRECT ANSWERS: • * That the graphs are “exactly identical”, which ignores the change of sign in the • x- and y-axes
2) A number of scientists who share the Nancy’s concerns have convened a panel of volunteer scientists drawn from five different universities and research centers to address this question of whether this data represents scientific misconduct or not. In defense of Mark, list examples of how this dataset might represent Mark’s honest representation of his scientific results. ONE POINT EACH (UP TO 2 POINTS MAX) IF STUDENT MENTIONS THE FOLLOWING: * Data may just happen to be identical, except for sign change of axes * Electrical behavior may be by-product of processing technique, independent of polymer * Mark may have accidentally mixed up the data * The samples may have been intentionally designed to show the response observed * The measurement equipment may have malfunctioned, generating false data
2) A number of scientists who share the Nancy’s concerns have convened a panel of volunteer scientists drawn from five different universities and research centers to address this question of whether this data represents scientific misconduct or not. In defense of Mark, list examples of how this dataset might represent Mark’s honest representation of his scientific results. EXAMPLES OF INCORRECT ANSWERS: * Mark is the only scientist capable of fabricating samples of this quality / others did not repeat the experiment correctly. (The issue is not that others cannot reproduce his data, the issue is why might the curves be so similar.) * Compare to data in the logbook or conduct the experiment again. (The question is not how to validate Mark’s data, but how he may have honestly arrived at this data.)
3) The panel is authorized to contact Mark and make up to three different scientific requests of him to establish the validity of Mark’s results. List three examples that a panelist could request and explain how it could help to identify whether scientific misconduct took place. ONE POINT EACH (UP TO 2 POINTS MAX) IF STUDENT MENTIONS THE FOLLOWING: * Examine laboratory notebook * View raw data * Ask Mark to repeat the experiment and provide fresh data * Ask for samples so that independent scientists can reproduce the data * Allow outside observer to examine Mark’s processing and testing of a new sample
Designing Critical Thinking Questions • 1. Choose a scenario from the examples listed. • 2. Create 2 critical thinking questions based on the critical thinking skills list • 3. Share with the larger group
Chem. Eng. 341: “Dynamics & Control of Chemical and Biological Processes” • Course themes: mathematical analysis of processes that change in time, strategies for controlling process dynamics • Pedagogical goal: improve students’ ability to utilize and draw appropriate conclusions from empirical data • Students:~30 senior ChE undergrads and a few MS Source: Joshua Leonard, ChE 341 2012 & 2013
In-class activity: critical thinking skills targeted • Summarize the pattern of results in a graph without making inappropriate inferences • Evaluate how strongly correlation-type data supports a hypothesis • Evaluate whether spurious information strongly supports a hypothesis • Identify additional information needed to evaluate a hypothesis Completely aligned with critical thinking questions
Innovation: Team-based critical thinking exercise using empirical data • Start with a set of “actual” experimental data • Goal: derive an empirical model of this process • Students work in teams of 3-4 to address prompts, discuss in teams and then as a class incinerator
Summarize/interpret these data. What conclusions can be drawn? • How strongly do these data support the hypothesis that the system exhibits FODT behavior?
Propose an alternative hypothesis that your team finds most compelling, and then propose additional experiments that could be conducted to evaluate your hypothesis. Explain why these experiments would let you evaluate which of these two hypotheses is most supported.
Now you repeat the experiment and measure the new data (X) shown above. To what extent do these new data support the original hypothesis and each of the alternatives proposed?
Insights and observations • General belief: infallibility of data • need models that “better fit the data” • Students initially lack the language to enunciate critical thinking analyses • language improves quality and precision of analysis • Key benefits of in-class activity • modeling critical thinking process and language • feedback from peers and instructor • expose and confront subconscious assumptions • Integration: follow up homework and final exam • Definitely some reflection of activities, but heterogeneous
EECS 384: “Solid State Electronic Devices” • Course themes: relating electronic materials properties to device operation • Pedagogical goal: improve students’ ability to work in groups and to solve critical thinking problems • Students:~12 senior EECS undergrads and junior grads
Innovation: Quiz Teams Learning objectives: critical thinking skills targeted • Develop dynamic group thinking skills • Develop awareness of multiple perspectives to each problem • Learn to present, defend, evaluate critical responses • Develop critical skills with different team partners
Innovation: Quiz Teams Method • Students group into Quiz-Teams of 3 students each to discuss three problems in a period of 5-7 min. • Students use hole-punch to commit to multiple choice answers • Quiz-Teams discuss their answers and their reasoning for 3 min. with the entire class • Quiz-Team partners change every two quizzes
#1) For the following basis vectors, what is the unit cell volume? A. a3 B. a3/2 C. 2a3 D. a3/4 Quiz Team Questions, Round 1-A #2) Select all point group symmetries (if any) that the left lattice has and the right does not have: reflection through a point about vertical axis reflection through a point about horizontal axis C. rotation through a point by 90 degrees D. translation to the right by a #5) Crystal systems are defined by point group symmetries alone, whereas Bravais lattices are additionally defined by translational symmetries. T. True Insufficient Information F. False
#1) For the following basis vectors, what is the unit cell volume? A. a3 B. a3/2 C. 2a3 D. a3/4 Quiz Team Questions, Round 1-A #2) Select all point group symmetries (if any) that the left lattice has and the right does not have: reflection through a point about vertical axis reflection through a point about horizontal axis C. rotation through a point by 90 degrees D. translation to the right by a #5) Crystal systems are defined by point group symmetries alone, whereas Bravais lattices are additionally defined by translational symmetries. T. True Insufficient Information F. False
Quiz Teams:Insights and observations • The students were engaged • Spirited discussions • Group dynamics clearly affected the decision • sometimes the loudest voices in a group would talk more timid ones away from the correct answer • High satisfaction with learning • Even when student team got problem wrong, they seemed quite eager to hear discussions and justifications of the correct explanation • seemed to recognize the missing piece which kept them from getting the correct answer when it was shown to them
Goals for us as scientists and for our students • Examine central issues and assumptions • Evaluate multiple perspectives • Recognize important relationships • Make correct inferences from evidence • Deduce conclusions from information or evidence • Interpret viability of conclusions, using evidence Potts, 1994; Tsui, 2006
Goals for us as scientists and for our students • Evaluate evidence or authority • Look for--or create--new solutions • Reframe problems, issues, questions • Reflect on one’s own gaps, strengths, weaknesses Potts, 1994; Tsui, 2006