Download
1 / 8
80 likes | 157 Vues
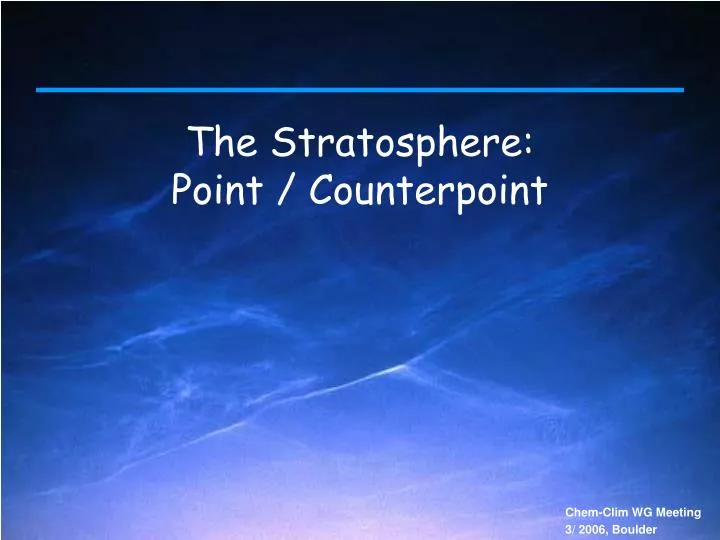
The Stratosphere: Point / Counterpoint. Solar Forcing. Coupler. Land. Atmosphere. Ocean. Sea Ice. C/N Cycle. Dyn. Veg. Ecosystem & BGC. Gas chem. Prognostic Aerosols. Upper Atm. Solar Cycle Studies: Model Input. Spectral composite courtesy of: Judith Lean (NRL) and

E N D
Solar Forcing Coupler Land Atmosphere Ocean Sea Ice C/N Cycle Dyn. Veg. Ecosystem & BGC Gas chem. Prognostic Aerosols Upper Atm.
Solar Cycle Studies: Model Input Spectral composite courtesy of: Judith Lean (NRL) and Tom Woods (CU/LASP)
Response of the upper atmosphere to solar variability Marsh and Matthes
Historical Forcings, including CFCs and volcanic aerosols Coupler Land Atmosphere Ocean Sea Ice C/N Cycle Dyn. Veg. Ecosystem & BGC Gas chem. Prognostic Aerosols Upper Atm.
Calculated and Observed Ozone Trends SAGE-I 1979-1981 and SAGE-II 1984-2000 Rolando Garcia • Red inset on left covers approximately same region as observations on right • Agreement is quite good, including region of apparent “self-healing” in lower tropical stratosphere
Calculated and Observed Temperature Trends SSU + MSU 1979-1998 Rolando Garcia • Red inset on left covers approximately same region as observations on right • Note comparable modeled vs. observed trend in upper stratosphere, although model trend is somewhat smaller
4 K 100 km -2 K 3 K 80 km -2 K 3 K 50 km -3 K 0.8 K 25 km -0.8 K Calculated Temperature Trends, 1950-2003 Global-means, deseasonalized Caution: 11-year solar signal not removed in trend calculations; this is large above 50 km, as shown on right