Download
1 / 20
200 likes | 503 Vues
F. Gelbert A. Henon, J.B. Gayet, N. Bouzar M. Perrin, L. Balabaud C. Mazel, R. Palau PARIS (France). DIFFUSION TENSOR TRACTOGRAPHY OF THE SPINAL CORD. Cervical spondylolis is found in 75% of patients over 65 years.

E N D
F. Gelbert A. Henon, J.B. Gayet, N. Bouzar M. Perrin, L. Balabaud C. Mazel, R. Palau PARIS (France) DIFFUSION TENSOR TRACTOGRAPHY OF THE SPINAL CORD
Cervical spondylolis is found in 75% of patients over 65 years. • The most seriouscomplication is cervical myelopathy, in 5% of patients suffering of spondylolis • The best treatment is surgerybut clinical symptoms are at first discret. • MR T2 hyperintensity is observed often late in the course of the desease.
Cervical Myelopathy Cervical myelopathy is caused by chronic segmental compression of the spinal cord because of spondylotic changes. The initial cause is thought to be a continuous or intermittent compression or pinching of the cord, which results in chronic hypoperfusion. Spondylotic changes Chronic segmental compression Chronic hypoperfusion T2 hypersignal vacuolization
Several study have assessed the feasability of diffusion techniques in spinal cord • In the spinal cord, white matter tracts are strongly organised in the cranio caudal direction so diffusion of water molecules is anisotropically oriented • The situation of the spinal cord in the spinal canal induce CSF and carotid flow artefacts and magnetic susceptibility artifacts cause by bone structures
30 patients 15 males/15 females; Age ranged from 34 to 79 years - mean age 50-65; 16 patients presented with cervical and/or cervico brachial pain 14 presented with walking impairement and clinical suspicion of cervical myelopathy
MR Protocol Signa GE 1.5T HDxt MRI scanner CTL coil in SAG T1, SAG T2 , AX T2 Diffusion protocolwasperformedusing a SE EPI sequence in both Sagittal and Axial plans b value of 750 s/mm2 9 encoding directions
Diffusion Hypothesis: In microscopicscale, water moleculesrandomly diffuses in isotropicenvironment (brownian motion) and in spinal cord water molecules diffuses mainlyalongfibers. Method Knowing diffusion direction itis possible to reconstructfiber bundle of the spinal cord. Post-Processing
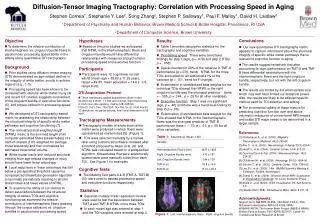
Results FA maps Fiber mapping ADC Maps
Results 3 situations Normal examination : 9 patients Focal cervical stenosiswithout spinal signal abnormality : 14 patients Cervical stenosis and spinal signal abnormality: 6 patients Otherdiagnosis: 1 SEP,1 syrinx
Situation 1- FA Cartography • :FA : normal values range from 0.6 - 0.55 • Same results in axial and sagittal acquisition
Situation 1- ADC Cartography • Normal ranged from (0,9 – 1,20). 10-9 • Same results in axial and sagittal acquisition
Situation 2 Ms A . 63 y.Upper limb paresis and cervical painCervical canal stenosis No signal abnormality • FA : 0.571-0.610 • ADC: 0.9
Situation 2Mr foug NCB . canal stenosis . No signal abnormalities normal ADC and FA values
Situation 3 Canal stenosis and spinal signal abnormality FA: 0.650 ADC= 1.1 ADC= 1.40 decreasedFA: 0.32
Situation 3 FA:0.6 ADC:1.25 FA: 0.4 ADC: 1.45
Situation …..4Patient witharmsweakness. No T2 signal changesFA and ADC « abnormal values » FA: 0.65 ADC:1.23 FA:0.4 ADC:1.50
Conclusion The calculation of FA and ADC was possible in all patients. ADC and FA measurements were reproductible in a same patients with different reviewers and we obtained a constant average of value in normal spinal cord We observed ADC and FA abnormal values in all cases of signal abnormalities
Conclusion We also observed ADC and FA abnormal values in 5 patients with clinincal symptoms and no signal abnormality This focuse the potential interest of this methods to detect earlier stages of spinal cord suffering These preliminary results must encourage us to include this sequence in the MR protocol of potential spinal cord lesions Axial or sagittal ? Both!!