Download
1 / 43
430 likes | 786 Vues
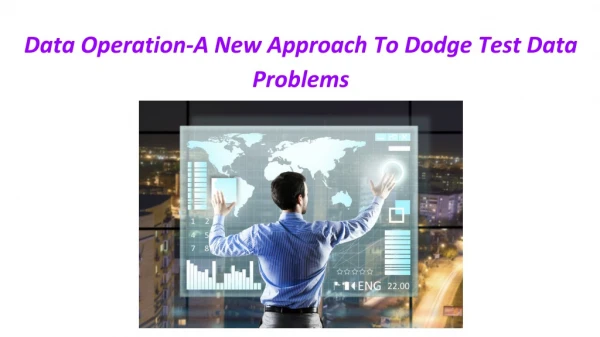
A New Approach to Plant Performance Improvement, Leveraging Data in OSI PI. María José Aniorte Antonio Calvo. Agenda. 1.- IBERDROLA & CMDS Overview 2.- Monitoring PIDs 3.- PID Analysis 4.- Looking for a solution PI-Plant Triage 5.- Expert Tune Plant Triage PROJECT

E N D
A New Approach to Plant Performance Improvement, Leveraging Data in OSI PI María José Aniorte Antonio Calvo
Agenda 1.- IBERDROLA & CMDS Overview 2.- Monitoring PIDs 3.- PID Analysis 4.- Looking for a solution PI-Plant Triage 5.- Expert Tune Plant Triage PROJECT 6.- Initial findings and control strategies improvement 7.- Models 8.- Conclusions & key lessons learned 9.- Questions and Answers
IBERDROLA OVERVIEW • Electric Power generation, transmission and distribution. • The most cost-effective energy producer in Spain • One of the most environmentally-friendly companies in Europe • €52 Billion Market Capitalization • €5.5 Billion sales in 2007 • Shareholders have Quadrupled investment in 5 years
IBERDROLA OVERVIEW Installed Capacity Total Production 123.460 40.822 +146% +141% 7.949 12.731 51.169 16.569 20.131 2000 2007 2000 2008 2008 x 2 + 16.000 MW 40.822 MW Hydraulic: 23,5% Hydraulic: 50% Power Station(coal and fuel): 15% Renewable: 3% Renewable: 20% Nuclear: 20% Nuclear: 8% Power Station (coal and fuel): 27% Cogeneration: 1,5% Combined Cycles: 31%
IBERDROLA in Spain We lead the construction of combined cycle power plants in Spain… Hydraulic: 8839 MW Nuclear: 3344 MW Coal: 1253 MW Fuel Oil: 1803 MW Cogen.: 380 MW Renewable: 4725 MW Total: 5.600 MW SANTURCE 400 MW, 109FA CASTEJÓN 400 MW, 109FA TARRAGONA POWER 400 MW , 1FA CASTELLÓN A 800 MW, 209FA CASTELLÓN B 800 MW, 209FB ARCOS I y II 800 MW, 2X10⁹ FA ESCOMBRERAS 800 MW, 209FB ARCOS III 800 MW, 209FB ACECA 400 MW, 109FA …5.600 MW since 2007
IBERDROLA in the world We lead electric private producer in México Combined Cycles Enertek 120 MW Tamazunchale Monterrey 1.040 MW Monterrey La Laguna II Altamira III y IV 1.036 MW Altamira III y IV Enertek La Laguna II 500 MW Altamira V 1.121 MW Tamazunchale 1.135 MW Oaxaca Altamira V Eolic CCGT Oaxaca 100 MW Wind … near 5.000 MW contracted power
IBERDROLA in the world IBERDROLA + Scottish Power 60.000 Million Euros Total Value 3rd European Utility Renewable World Leader
IBERDROLA in the world IBERDROLA + Energy East 65.000 Millions Euro Total Value Up to 42.000 MW Installed Capacity 4th World Utility
CMDS – Monitoring Diagnostic and Simulation Center Technology Center for Combined Cycles since 2002 • MAIN GOALS • Maximize efficiency, availability and reliability • Support power plants to: • O&M in an optimum way • Minimize costs • Unify technology management POWER PLANTS O&M OPTIMISATION ADDITIONAL PROFITS • Common O&M model for all stations : Fleet approach • O&M on-site and on-line support • Share operational experiences and best practices • Center of Excellence • Reduce OEM dependency
CMDS Organization CMDS Manager 10 6 16 AEMA Apoyo a la Explotación y al MAntenimiento SERIT SERvicios de Infraestructura Tecnológica TEDIC Técnicas de DIagnóstico y Control - Performance Analysis - Vibration Analysis - PDA Analysis - Early Warning A&D - Control Systems - Incident Analysis - Maintenance Support - Simulators - Information Security - SW Development - Technical Support
CMDS Scope ‘08 CombinedCycles CC Riga 400 MW La Laguna500 MW Monterrey III 1000 MW Jun’02 Santurce 4 400MW Ene ‘05 Altamira III y IV 1000 MW Nov’03 Castejón 1 400MW Abr’03 Altamira V 1000MW Jun’06 Tarragona Power 400MW Ene’04 Aceca 3 400MW Jun’05 Tamazunchale 1000MW Junio’07 Castellón 3 800MW Sep’02 Castellón 4 800 MW Dic´07 Arcos 1 y 2 800MW Dic’04 Escombreras 6 800MW Nov’06 Arcos 3 800MW Jun’05 Termopernambuco 500MW Feb’04
Monitoring • Whatis monitoring?. We do standard checks during start up and normal operation, focusing on key parameters in our process. • What do we monitor? Process signals are configured in our PI Data Bases • All analog signals (inputs and outputs) • Limit Switches • Valves and motors orders and feedbacks • Some other digital signals 10.000 tags 2x1 5.000 tags single shaft
Monitoring • What Tools do we use mainly? • Remote access to DCS • Model-making Programs • PI
Monitoring Tools PI PROCESS BOOK APLICATIONS Specific Charts
Monitoring Tools PI - ACE APPLICATIONS SMS Rule Programming E-Mails ACE Module Alarms Screens
PID Monitoring • What is a PID? A generic control loop feedback mechanism widely used in industrial control systems. A PID controller attempts to correct the error between a measured process variable and a desired setpoint by calculating and then outputting a corrective action that can adjust the process accordingly. Control Room Error=PV-SPT 0 Control Procesors PIDs Input Spt LT SetPoinT Output Process Variable
PID Monitoring • What is a PID? Error=PV-SPT 0 LT SetPoinT Proccess Variable MA OutPut PV SPT
PID Analysis Effects of Poor PID Control What happens if the loop is not working properly? Poor Plant Performance Less $$ -Less consistent production -Less reliability Higher occurrence of plants alarms and trips -Higher energy cost -Longer time for start-ups and load changes -Higher maintenances cost valve travel, pump starts and stops -More operator actions
PID Analysis – What can be found? • Set point is not achieved Warnings: • Oscillation • Steady state but there is an error • Why the set point is not achieved? Root Causes • Valve stiction: Stiction is the resistance to the start of motion. • Bad Tuning • Loop coupling • Disturbance
Howtomanagehundreds of loops? • How many PIDs are we talking about? X 60 582 LOOPS
Howtomanagehundreds of loops? • To analyze a PID we need mathematics • Closed Loop Frequency Response • Cross correlation Between two variables • Closed loop Impulse response • Variability and Variance • Time in Mode • 24x7 monitoring • We need a tool PLANT TRIAGE MA OutPut PV SPT
Lookingfor a solution PI-PT x 9 + …
Lookingfor a solution PI-PT Plant Triage Server AIM*HDA OPC SERVER Clients PC Performance Reports Central PI
ExperTunePlantTriage PROJECT • Scope of the Project • OPC HDA Server communication to OSI-PI • PID control loops response monitoring, diagnostic and improvement • 9 Plants (3 multi-shaft GTCC + 6 single shaft GTCC) • 110 units (9 or 10 for each HRSG or GT) • 582 PID control loops (approx. 50 per HRSG or GT) • Invensys Foxboro DCS • PlantTriage V6 Installation, loops configuration and PT upgrade to V7. • On-site support from Invensys • From now, effortless expansion to other vendors DCS’s (GE mostly, but also ABB, Yokogawa,…)
Configurationtasks • Import file (*.csv) • Economic Significance (HIGH<10%; AVG 60-70%; LOW 20-30%) • Loop type definition (Master/Slave, Ctrl’d variable, Final ctrl element,...) • Loop & unit status bits • 71 Baselines & Thresholds (TEMPLATES, then one by one) To do this configuration, but even more to analyze data afterwords, it is manda- tory a deep knowledge on the plant process. Not to be done only by an IT person.
Configurationtasks • Data that is needed to import from OSI-PI OPC HDA Server • - Process Value (PV) • - Set Point (SP) • - Controller Output (OP) • - Controller mode (Not only Auto/Man but also tracking) • Data that is optional to import from OSI-PI OPC HDA Server • - Proportional Band • - Integral Band • - Derivative Band • - Filter • Additional data necessary to configure each loop (PV and SPT limits, CO limits, controller type & action, control loop description, process & structure, estimated process dead time, status bit for on/offline…) • With more structure information in PlantTriage, you will get more specific analysis.
KPI TreeMap (LoopHealth) • TreeMap and GTCC sites How to quickly find the most important problems?
Initialfindings • Initial problems grouping and tracking At first glance, >10% loops behaviour could be improved easily
InitialFindings. Opportunities. • Control valve trim wear a) The process Flow rate controller to assure a minimum flow through the intermediate pressure feedwater pumps Two pumps, then two controllers per boiler.
InitialFindings. Opportunities. • Control valve trim wear b) What was observed with PT At minimum GT load, the flow rate controller valve opens to 3% or 4%. As a consequence, the trim suffers from wearing. This condition may be maintained for hours during nights or weekends.
InitialFindings. Opportunities. • Control valve trim wear c) The solution A recalculation of minimum required flow rate for the pump was asked to the vendor. A logic condition was implemented to the controller output to avoid too low output values: “ if OUT<5%, then OUT=0% “ The same system was checked in other plants d) Savings Direct savings: trim change Indirect savings: avoid one plant trip (real problem!) HIGH COST!!! A Single Turbine Trip may cost more than € 50,000
Control strategiesimprovement • Recurrent oscillating loop response a) The process The drum receives condensed water and steam from multiple pipeline drainages. Drum level is main- tained at a fixed value through PID control and tempera- ture is kept via on/off control.
Control strategies improvement • Recurrent oscillating loop response b) What was observed with PT and OSI-PI • The level is oscilating. • Valve never stops
Control strategiesimprovement • Recurrent oscillating loop response c) The proposed solutions Ctrl strategy improvement: Add a BIAS to decrease the controller output when atempe- ration valve closure is detected and to increase it as it opens. Several trials to get the optimum BIAS values. Retune Controller Mechanical change: Valve substitution from 1” to ¾” with lower Cv. d) Savings Direct savings: Trim Change Pump maintenance Indirect savings Drum level HH overflow (accident due to 90ºC water spillage) To avoid an accident is not measurable
Control strategies improvement e) Results
PlantTriageModels • Auto Model Capture Tool (AMCT) • PID Loop Optimizer • Analyzer • Tuner
PlantTriageModels • PID Loop Optimizer • Now, working on • this to make new • proposals based • on PID control • theoretical calcula- tions coming from real plant data. Reduces engineering time required for loop tuning.
Conclusions • Take time to make a good database configuration • Initially, focus on fixing direct problems • Savings on final control elements maintenance (valves) • Modifications in tuning PID parameters (variable tuning?) • Reduce oscillation and variability • Following-up reported problems is essential to success! • Create and follow-up control loop quality assessments or KPI • Review control strategies if PID control is not enough • Success requires cooperation between operations, maintenance and engineering
Results • More efficient use of engineer’s time • Reduced turbine trips • Production increase 0,5- 5MW* • Cost Reduction >100000€/year* • Efficiency • ROI, 15 Months *All this data is an estimate based in the improvements we have already achieved.