Download
1 / 33
690 likes | 1.55k Vues
The A3 Process and A3 Thinking. The source for much of this is material is from: “Understanding A3 Thinking” Durward K. Sobek II and Art Smalley CRC Press. What is an A3?. Problem Solving Tool Developed by Toyota Supported PDCA Supported Total Quality program

E N D
The source for much of this is material is from: “Understanding A3 Thinking” Durward K. Sobek II and Art Smalley CRC Press
What is an A3? • Problem Solving Tool • Developed by Toyota • Supported PDCA • Supported Total Quality program • Top management preferred visual control over lengthy text reports • A3 name derived from size of paper used (A3 is metric equivalent of 11 x 17 paper)
Problem Solving at Toyota • Ultimate Goal is a problem resolved • So it is less likely to occur in the future • Skill of the problem solver is increased so they can handle more challenging problems in the future * Process to solve problem is more critical that short term results
Why A3? • Allows collaborative in-depth problem solving • Drives towards Root Cause • Defines the issue through the “Eyes of the Customer” • Forces an understanding of the Current Condition before jumping to solutions • Provides a consistent approach to Problem Solving • It is easy to learn and remember
A3 and Lean • Direct tie in and support of: • Value Stream Mapping • Kaizen Philosophy • Fast Response
A3 Involves • Actual Observations • Collection of Facts and Data • Interviews • Analysis • Good Problem Solving Skills • It is also recommended that a coach/adviser assist with dialog, critique, feedback, and development.
A3 versus A3 Thinking • A3 is a problem solving tool • Used without A3 thinking it is just another tool, that will get the same results as PDCA, or any other tool A3 Thinking is the process of logically working through a problem in a systematic and standard method -The A3 form serves as the roadmap to guide the thinking
The 7 Elements of A3 Thinking • Logical Thinking Process • Objectivity • Results and Process • Synthesis, Visualization, Distillation • Alignment • Coherency within and Consistency across • Systems Viewpoint
The 7 Elements of A3 Thinking • Logical Thinking Process • A3 thinking promotes Scientific Method of investigation • Importance is placed on factually discerning the difference between Causeand Effect • Takes into account • Numerous potential avenues • Effects of implementation • Possible stumbling blocks • Contingencies
The 7 Elements of A3 Thinking • Objectivity • Quantitative facts are used to verify understanding • Facts and Details are framed as objectively as possible • Courses of action promote organizational good vs. personal agendas
The 7 Elements of A3 Thinking • Results and Process • A3 Thinking is a Process that drives Results • Results without process lead to little long term value • Process without results fails to move the organization forward • A3 Thinking By You • Allows you to know how well a person understands the problem • Understand how a solution fits into the larger picture
The 7 Elements of A3 Thinking • Synthesis, Visualization, and Distillation • Brevity of reports forces synthesis of information to only the most vital points • A3 thinking encourages information through graphical representation to communicate the message clearly and efficiently • Graphical information, clearly and concisely stated, distills thinking to critical facts
The 7 Elements of A3 Thinking • Alignment • Inclusion of the problem, the analysis, the actions, and the follow-up plan gives all team members something concrete to agree or disagree with • A3 structure provides a vehicle for communication • Horizontally – those affected by change • Vertically – the hierarchy of the organization • Back and Forth in Time – a record of past remedies and recommendations to consider for the future
The 7 Elements of A3 Thinking • Coherency Within, Consistency Across • A3 report structure establishes a logical flow that promotes coherency in the approach and thinking • Flow of the A3 promotes consistency across the organization, that speeds up communication and understanding
The 7 Elements of A3 Thinking • Systems Viewpoint • A3 format demonstrates that the problem solver • Has a purpose for the actions proposed • Actions proposed further the organization’s goal, needs, and priorities • Understands how the actions proposed affect other parts of the organization
Select A Problem • Objectively describes the PROBLEM • Is described in action • Reduce • Eliminate • Improve *Should not contain a solution
Grasp the Current Situation • Background to the Problem • Written for a target audience • What is their background? • What is their informational need? • Tied to a company (business) goal • Is Clear and Visual • Use historical data and dates • Help the audience understand the problem
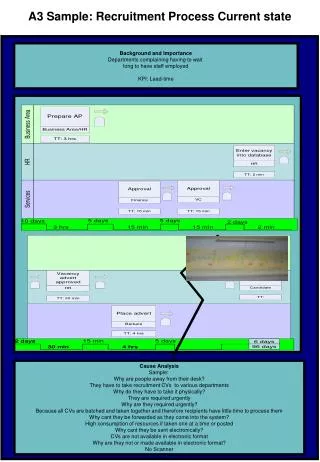
Grasp The Current Situation • The Current State Before a problem can be properly addressed, one must have a firm grasp of the current situation. To do this, Toyota suggests that problem-solvers: • Observe the work processes first hand, and document one’s observations. (Go to GEMBA) • Quantify the magnitude of the problem (e.g., % of customer deliveries that are late, # of stock outs in a month, # of errors reported per quarter, % of work time that is value-added); if possible, represent the data graphically • Create a diagram that shows how the work is currently done. Any number of formal process charting or mapping tools can be used, but often simple stick figures and arrows will do the trick.
Target • How will we know the project is successful? • What will be the standard for comparison? • Make the goal measurable • Consider how to collect the data to validate effectiveness
Root Cause Analysis • 5 Why’s Analysis (Root Cause) • Failure to address the root seed of the problem, most likely means it will reoccur • 5 Whys technique used by TOYOTA to dig to root cause • Structured tests and experiments when 5 Whys do not deduce root cause • Key Questions: • Are the work activities specified in terms of content, timing, sequence, and outcome? • Are the connections between entities clear, direct and immediately comprehensible? • Are the pathways along which goods and services travel simple, direct, uninterrupted, and value add? *Almost all failing systems violate one of these
Countermeasures • Devising Countermeasures • Once root cause is identified then brainstorming changes to the system (countermeasures) to address the root cause begins • Countermeasures should be designed to prevent a reoccurrence of the root cause • Emphasis on Why the problem occurred not just fixing the problem • Multiple countermeasures are encouraged to help insure a systems viewpoint *Like the Current State the Future State should also be expressed graphically
Creating an Implementation Plan • Should include the 4W’s and 1 H • Who is responsible for the countermeasure • What is the cause of the problem • When it will be implemented • Why this countermeasure is being implemented • How will this be implemented * Also includes the expected outcome of each task
Effect Confirmation • Effect Confirmation • Graphical representations of the effects of the Implementation Plan • Use the same standard as in the Goal section • Try to verify the effectiveness of each countermeasure • Plan in advance the data collection strategy • Identify who will collect the data and how often it will be collected
Follow-up Actions Follow-up Actions • What have we learned? • What additional changes are needed from our learning? • Can other areas within our department/plant benefit from our changes? • Can other areas of the company benefit from our changes? • Do our changes need documented? • Do our standards need changed?
Follow-up Actions • Creating a Follow Up Plan • Important to verify the actual results against the predicted results • Was the implementation plan effective? • Did you learn enough about the problem to devise countermeasures that actually worked? • Demonstrates that the organization is paying attention to problems
Obtaining Approval • Not done as a bureaucratic step • Is an opportunity to mentor • Was their rigor in the development of the A3? • Did the problem solver visit Gemba? • Does the root cause make sense? • Do the countermeasures address the root cause? • Is the implementation plan realistic? • Is the follow up plan (metrics) substantive?
Example A3’s A3 Examples
Example A3’s A3 Examples
Example A3’s A3 Examples