Download
1 / 47
470 likes | 610 Vues
26. Population Growth and Regulation. 0. How Does Population Size Change?. Population community ecosystem biosphere Ecology is the study of the interrelationships of organisms with each other and with the nonliving environment. How Does Population Size Change?.

E N D
26 Population Growth and Regulation 0
How Does Population Size Change? • Population community ecosystem biosphere • Ecologyis the study of the interrelationships of organisms with each other and with the nonliving environment
How Does Population Size Change? • Changes in population size result from natural increases and net migration • Population size changes through • Births • Deaths • Net migration
How Does Population Size Change? • Changes in population size result from natural increases and net migration (continued) • A population thus grows when the sum of natural increase and net migration is positive and declines when this sum is negative • A simple equation for the change is • Change in population size natural increase net migration (births deaths) (immigration emigration)
How Does Population Size Change? • Populations grow based on the birth rate, the death rate, and the population size • The size of most natural populations of organisms fluctuates over the course of a year because reproduction tends to be seasonal • Growing populations add individuals in proportion to the population’s size, much like a bank account accumulates compound interest • If conditions are the same, a population will grow at a constant percentage of its size over a given interval
How Does Population Size Change? • Populations grow based on the birth rate, the death rate, and the population size (continued) • The growth rate (r) of a population is the percentage change in the population size per unit time • The population growth rate is the birth rate (b) minus its death rate (d) • r (growth rate) b (birth rate) d (death rate)
How Does Population Size Change? • Populations grow based on the birth rate, the death rate, and the population size (continued) • If births exceed deaths, exponential growth occurs • A constant growth rate (r) produces exponential growth • During exponential growth, an ever-larger number is added to the population during each succeeding time period • If the size of an exponentially growing population is graphed against time, a characteristic shape called a J-curve will be produced • The age at which an organism first reproduces affects the size of the future population
Figure 26-1 Exponential growth curves are J-shaped 2,600 reproduce at 4 years (pop. 1) Numberofeagles(pop. 1) Numberofeagles(pop. 2) 2,400 reproduce at 6 years (pop. 2) Time(years) 2,200 At 24 years,this populationhas 2,504 eagles 2,000 0 2 2 1,800 6 8 4 1,600 12 18 52 1,400 number of eagles 18 86 362 1,200 24 392 2,504 1,000 800 1,764 17,314 30 600 At 24 years,this populationhas 392 eagles 400 200 0 5 15 10 20 25 30 time (years)
How Does Population Size Change? 2,500 no deaths It takes about 5.5hours to produce1,500 bacteria 10% death rate 25% death rate 2,000 • Populations grow based on the birth rate, the death rate, and the population size (continued) • If births exceed deaths, exponential growth occurs • The death rate has a major impact on population size • As long as births exceed deaths, the population eventually becomes enormous • As the death rate increases, it takes longer to reach any given population size It takes about 4hours to produce1,500 bacteria 1,500 It takes about 3.5hours to produce1,500 bacteria 1,000 number of bacteria 500 0 6 1 2 5 3 4 time (hours)
How Does Population Size Change? • Biotic potential determines the maximum rate at which a population could increase • Several factors influence biotic potential • The age at which the organism first reproduces • The frequency of reproduction • The average number of offspring produced each time • The length of the organism’s reproductive life span • The death rate of individuals
How Is Population Growth Regulated? • Population size results from the interaction between biotic potential and environmental resistance, or all the curbs on population growth imposed by the living and nonliving environment Examples: • interactions among organisms such as predation and competition for limited resources • natural events such as freezing weather, storms, fires, floods, and droughts
How Is Population Growth Regulated? • Exponential growth only occurs under unusual conditions • Under unusual and temporary circumstances, natural populations exhibit exponential growth, producing J-shaped growth curves
How Is Population Growth Regulated? • Exponential growth only occurs under unusual conditions (continued) • Exponential growth occurs in populations with boom-and-bust cycles • periods of rapid population growth are followed by a sudden, massive die-off • Seasonal populations are linked to changes in rainfall, temperature, or nutrient availability • Ideal conditions encourage rapid growth; deteriorating conditions encourage massive die-off
14 Nutrients are depleted, andwater temperature falls 12 10 8 6 “boom” “bust” Favorable growthconditions occur population density number per 100 trap nights 4 2 0 2000 1985 1990 1995 Sep Jul May Jan Mar Nov year month Boom-and-bust cycles in a lemming population inthe Canadian Arctic. A boom-and-bust cycle in photosynthetic bacteria
How Is Population Growth Regulated? 450 425 400 375 350 • Exponential growth only occurs under unusual conditions (continued) • Exponential growth occurs temporarily when environmental resistance is reduced • Populations that do not experience boom-and-bust cycles • Special circumstances: • A reduction in predation • An increase of food supply or habitat 325 300 275 250 225 200 number of cranes 175 150 125 100 75 50 25 0 1940 1950 1960 1970 1980 2000 1990 2010 year
How Is Population Growth Regulated? • Exponential growth only occurs under unusual conditions (continued) • Exponential growth occurs temporarily when environmental resistance is reduced (continued) • Exponential growth can occur when individuals invade a new habitat with little competition • Invasive species are organisms with a high biotic potential that are introduced into ecosystems where they did not evolve and where they encounter little environmental resistance
How Is Population Growth Regulated? • Environmental resistance limits population growth • Many populations that exhibit exponential growth eventually stabilize to match the resources available to support them • As resources become depleted, reproduction slows and the growth rate eventually drops to zero, causing the population size to remain constant
How Is Population Growth Regulated? • Environmental resistance limits population growth (continued) • Logistic growth occurs when new populations stabilize as a result of environmental resistance • This growth pattern, where populations increase to the maximum number sustainable by their environment and then stabilize, is called logistic population growth • The maximum population size that can be sustained by an ecosystem for an extended time without damage to the ecosystem is called its carrying capacity (K)
Figure 26-5a An S-shaped growth curve stabilizes at carrying capacity carrying capacity Growthrate slows Growth stops and thepopulation stabilizes closeto the carrying capacity Populationgrows rapidly number of individuals 0 time An S-shaped growth curve stabilizes at carrying capacity
How Is Population Growth Regulated? • Environmental resistance limits population growth (continued) • Logistic growth (continued) • In nature, an increase in population size (N) above carrying capacity (K) can be sustained for a short time • If a population far exceeds the carrying capacity of its environment, excess demands placed on the ecosystem are likely to destroy crucial resources • This can permanently and severely reduce carrying capacity, causing the population to decline to a fraction of its former size or disappear entirely
How Is Population Growth Regulated? • Logistic growth (continued) • Occurs in nature when a species moves into a new habitat • For example, new barnacle settlers along a rocky coast may find ideal conditions that allow their population to grow exponentially • As population density increases, however, individuals begin to compete for space, energy, and nutrients 80 60 number of barnacles (per cm2) 40 20 0 5 4 2 3 1 time (weeks)
How Is Population Growth Regulated? • Environmental resistance limits population growth (continued) • Two forms of environmental resistance usually maintain populations at or below the carrying capacity of their environment • Density-independent factors limit population size regardless of the population density • Density-dependent factors increase in effectiveness as the population density increases
How Is Population Growth Regulated? • Two forms of environmental resistance • Density-independent factors limit populations regardless of their density • The most important natural density-independent factors are climate and weather, which are responsible for most boom-and-bust population cycles • Many insects and annual plant populations • Hurricanes, droughts, floods, and fire
How Is Population Growth Regulated? • Two forms of environmental resistance • Density-independent factors (continued) • Human activities can also limit the growth of natural populations • Pesticides and pollutants can cause drastic declines • Overhunting has driven some species to extinction • Habitat destruction by humans is the single greatest threat to wildlife worldwide
How Is Population Growth Regulated? • Two forms of environmental resistance • Density-dependent factors (continued) • Populations of organisms with a life span of more than a year have evolved adaptations that allow them to survive density-independent controls imposed by seasonal changes, such as cold and lack of food during the winter
How Is Population Growth Regulated? • Two forms of environmental resistance • Density-dependent factors (continued) • Density-dependent factors exert a negative feedback effect on population size, because they become increasingly effective as the population density increases • Predators exert density-dependent controls on populations • Prey are killed directly and eaten, but not always
How Is Population Growth Regulated? • Two forms of environmental resistance • Density-dependent factors (continued) • Predators exert density-dependent controls • Predation becomes important as prey populations grow because predators eat a variety of prey, depending on what is most abundant and easiest to find • Predator populations often grow as their prey becomes more abundant, which makes them even more effective as control agents Predator populations oftenincrease when prey are abundant
How Is Population Growth Regulated? bean weevils (prey) 1,600 braconid wasp (predator) A high predatorpopulationreduces the preypopulation The prey populationpeaks when thepredator populationis low • Two forms of environmental resistance • Density-dependent factors (continued) • Some predator-prey population cycles are out-of-phase 1,200 adult population 800 400 0 20 30 5 10 15 25 generation
How Is Population Growth Regulated? • Two forms of environmental resistance • Density-dependent factors (continued) • Parasites spread more rapidly among dense populations • Cannot travel long distances • Parasites influence population size by weakening their hosts and making them more susceptible to death from other causes, such as harsh weather or predators • Organisms weakened by parasites are less likely to reproduce
How Is Population Growth Regulated? • Two forms of environmental resistance • Density-dependent factors (continued) • Competition for resources helps control populations • Competition is the interaction among individuals who attempt to use the same limited resource • There are two major forms of competition • Interspecific competition, between individuals of different species • Intraspecific competition, between individuals of the same species
How Is Population Growth Regulated? • Two forms of environmental resistance • Density-independent and density-dependent factors interact to regulate population size • The size of a population at any given time is the result of complex interactions between density-independent and density-dependent forms of environmental resistance • For example, a caribou weakened by hunger (density-dependent) and attacked by parasites (density-dependent) is more likely to be killed by an exceptionally cold winter (density-independent)
Review • Describe exponential growth. • When would exponential growth occur? • Describe a logistic growth curve. • What are the two major forms of environmental resistance?
How Are Populations Distributed in Space and Age? • Populations exhibit different spatial distributions • Spatial distribution describes how individuals within a population are distributed within a given area • Spatial distribution may vary with time, changing with the breeding seasons • Ecologists recognize three major types of spatial distribution: • Clumped • Uniform • Random
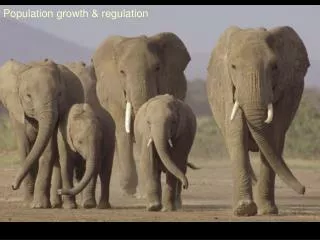
How Are Populations Distributed in Space and Age? • Populations exhibit different spatial distributions • Populations whose members live in groups exhibit clumped distribution • Examples include elephant herds, wolf packs, prides of lions, flocks of birds, and schools of fish clumped Clumped distribution
How Are Populations Distributed in Space and Age? • Populations exhibit different spatial distributions • Advantages of clumped distributions include • Many eyes that can search for localized food sources • Movement of the group (e.g., schools of fish or flocks of birds) can confuse predators by their sheer numbers • Predators, in turn, may hunt in groups, cooperating to bring down larger prey
How Are Populations Distributed in Space and Age? • Populations exhibit different spatial distributions • Uniform distribution maintain a relatively constant distance between individuals • This is common among territorial animals defending scarce resources or breeding territories uniform Uniform distribution
How Are Populations Distributed in Space and Age? • Populations exhibit different spatial distributions • Random distributionis relatively rare • Such individuals do not form social groups • The resources needed are more or less equally available throughout the area they inhabit • Resources are not scarce enough to require territorial spacing • Examples include trees and other plants in rain forests random Random distribution
Figure 26-13 Survivorship tables and survivorship curves 1,000 Age Numberof survivors 100,000 0 (birth) 10 99,124 100 20 98,713 late loss(human) 30 97,754 40 96,489 number of survivors constant loss(American robin) 50 93,698 10 60 87,967 early loss(dandelion) 70 76,241 80 54,117 90 22,312 0 100 2,523 percent of maximum life span A survivorshiptable Survivorship curves
How Is the Human Population Changing? 7 2011 Date Billions Time to add each billion(years) 6 1999 • The human population continues to grow rapidly All of humanhistory 1804 1 1987 5 1927 2 123 year 3 1960 33 4 1975 1975 4 14 1987 13 5 billions of people 1999 6 12 1960 3 12 2011 7 2025 14 8* *projected 1927 2 bubonicplague 1 1804 0 8000 1000 12,000 11,000 10,000 4000 2000 1000 2000 9,000 7000 6000 3000 B.C./A.D. 5000 B.C. B.C. B.C. B.C. B.C. B.C. A.D. A.D. B.C. B.C. B.C. B.C. B.C. B.C. Technical advances Agricultural advances Industrialand medicaladvances
How Is the Human Population Changing? • A series of advances has increased Earth’s carrying capacity to support people • Early humans • Discovered fire • Invented tools and weapons • Built shelters • Designed protective clothing – small stable populations • Agricultural advances – longer life span but high death rate • Medical advances – decreased birth and death rate
How Is the Human Population Changing? • The age structure of a population predicts its future growth • Age structure diagrams show age groups on the vertical axis and the numbers (or percentages) of individuals in each age group on the horizontal axis, with males and females shown on opposite sides • Age structure diagrams all rise to a peak that reflects the maximum human life span • The shape of the rest of the diagram reveals whether the population is expanding, stable, or shrinking
Figure 26-16a Africa: A rapidly growing population Africa 2010 100 female male 90 80 70 60 age 50 40 30 20 10 0 2 4 2 6 0 6 4 percent of population Africa: A rapidly growing population
Figure 26-16b North America: A slowly growing population North America 2010 100 female female male 90 80 70 60 age 50 40 30 20 10 0 2 4 2 6 0 6 4 percent of population North America: A slowly growing population
Figure 26-16c Europe: A slowly declining population Europe 2010 100 female male 90 80 70 60 age 50 40 30 20 10 0 2 4 2 6 0 6 4 percent of population Europe: A slowly declining population
How Is the Human Population Changing? • The age structure of a population predicts its future growth • Median age – age at which half the population is younger and half is older • The median age depends on the age structure • The lower the median age, the more rapidly the population will expand • In a stable human population, fewer than 20% of individuals are younger than age 15
Figure 26-18 United Nations world population projections 12 11 high 10.6 10 9.3 9 medium 8.1 world population (billions) 8 low 7 6 2000 2010 2020 2030 2040 2050
Review • Explain the three basic types of distribution within populations. • Describe the three general types of survivorship curves. • How does the shape of an age structure diagram predict future changes in population sizes?