Download
1 / 5
50 likes | 53 Vues
This study investigates the effect of Twist1 knockdown on Foxa1 expression in MDA-MB-436 breast cancer cells, revealing a positive correlation between Twist1 suppression and increased Foxa1 levels. The findings suggest a potential regulatory role of Twist1 in modulating Foxa1 expression in breast cancer.

E N D
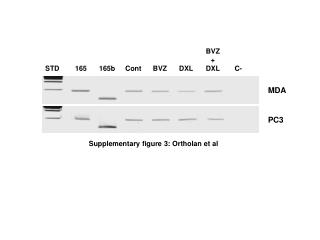
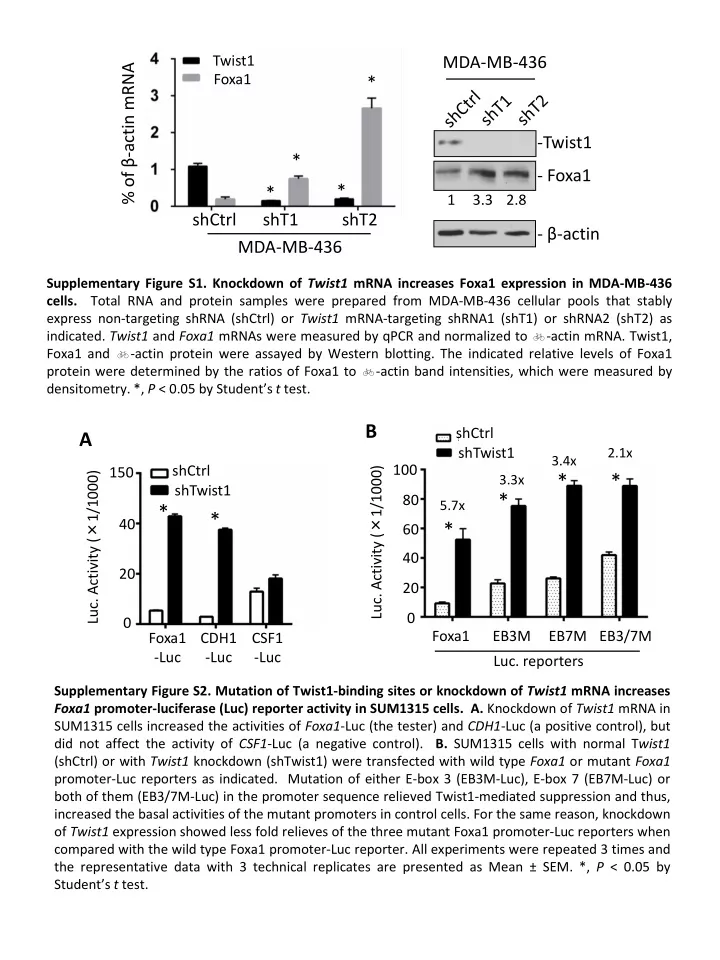
B shCtrl A shTwist1 2.1x 3.4x shCtrl 100 150 * * 3.3x shTwist1 Twist1 * MDA-MB-436 80 5.7x * Foxa1 * * 40 * 60 shCtrl shT1 shT2 Luc. Activity (×1/1000) Luc. Activity (×1/1000) 40 % of β-actin mRNA 20 -Twist1 20 * Supplementary Figure S1. Knockdown of Twist1 mRNA increases Foxa1 expression in MDA-MB-436 cells. Total RNA and protein samples were prepared from MDA-MB-436 cellular pools that stably express non-targeting shRNA (shCtrl) or Twist1 mRNA-targeting shRNA1 (shT1) or shRNA2 (shT2) as indicated. Twist1 and Foxa1 mRNAs were measured by qPCR and normalized to b-actin mRNA. Twist1, Foxa1 and b-actin protein were assayed by Western blotting. The indicated relative levels of Foxa1 protein were determined by the ratios of Foxa1 to b-actin band intensities, which were measured by densitometry. *, P < 0.05 by Student’s t test. - Foxa1 0 0 * * 1 3.3 2.8 Foxa1 EB3M EB7M EB3/7M Foxa1 -Luc CDH1 -Luc CSF1 -Luc shCtrl shT1 shT2 - β-actin MDA-MB-436 Luc. reporters Supplementary Figure S2. Mutation of Twist1-binding sites or knockdown of Twist1 mRNA increases Foxa1 promoter-luciferase (Luc) reporter activity in SUM1315 cells.A. Knockdown of Twist1 mRNA in SUM1315 cells increased the activities of Foxa1-Luc (the tester) and CDH1-Luc (a positive control), but did not affect the activity of CSF1-Luc (a negative control). B. SUM1315 cells with normal Twist1 (shCtrl) or with Twist1 knockdown (shTwist1) were transfected with wild type Foxa1 or mutant Foxa1 promoter-Luc reporters as indicated. Mutation of either E-box 3 (EB3M-Luc), E-box 7 (EB7M-Luc) or both of them (EB3/7M-Luc) in the promoter sequence relieved Twist1-mediated suppression and thus, increased the basal activities of the mutant promoters in control cells. For the same reason, knockdown of Twist1 expression showed less fold relieves of the three mutant Foxa1 promoter-Luc reporters when compared with the wild type Foxa1 promoter-Luc reporter. All experiments were repeated 3 times and the representative data with 3 technical replicates are presented as Mean ± SEM. *, P < 0.05 by Student’s t test.
ChIP * 5.5 226% shCtrl shTwist1 3.5 1.5 0.8 * % of Input Supplementary Figure S3. Knockdown of Twist1 mRNA reduced MTA2 and HDAC2 recruitments but increased H3K9-Ace and RNA polymerase II (RNA-PII) recruitment to the Foxa1 promoter in SUM1315 cells. ChIP assays were performed with SUM1315 cells with normal Twist1 (shCtrl) or Twist1 knockdown (shTwist1) and with non-immune IgG (negative control) or antibodies against Twist1, HDAC2, MTA2, H3K9-ace or RNA-PII as indicated. The input and precipitated DNA samples were analyzed by real-time PCR that amplifies the E-box 3 region of the Foxa1 promoter. All experiments were repeated 3 times and the representative data with 3 technical replicates are presented as Mean ± SEM. *, P < 0.05 by Student’s t test. * 0.4 * 153% 37% 15% 77% 0 IgG IgG a-H3K9-Ace a-RNA-PII a-MTA2 a-HDAC2 a-Twist1 c-Fos Twist1 * % of β-actin mRNA sic-Fos siCtrl MCF7 Supplementary Figure S4. Knockdown of c-Fos mRNA in MCF7 cells does not change Twist1 mRNA. MCF7 cells were transfected with siCtrl or sic-Fos siRNA. qPCR assays were performed to measure c-Fos and Twist1 mRNA levels. *, P < 0.05 by Student’s t test.
B A shCtrl * ChIP 120 shTwist1 80 shCtrl 0.10 40 shTwist1 * Luc. Activity (×1/1000) % of Input 10 0.05 5 * * 0 0 IgG a-c-Fos Foxa1 AP1-M1 AP1-M2 AP1-M1/2 Luc. reporters Supplementary Figure S5. Twist1 inhibits AP1-activated Foxa1 promoter activity in SUM1315 cells. A. Knockdown of Twist1 mRNA by shTwist1 increased c-Fos recruitment to the Foxa1 promoter. ChIP assays were performed with SUM1315 cells expressing non-targeting shRNA (shCtrl) or shTwist1 that targets Twist1 mRNA and with control IgG or c-Fos antibody as indicated. B. Mutation of AP-binding sites in the Foxa1 promoter decreased the promoter activity and knockdown of Twist1 expression markedly increased wild type Foxa1 promoter activity but only slightly increased the Foxa1 promoter with mutated AP-1 sites. SUM1315 cells expressing shCtrl or shTwist1 were cultured in 24 well plates and transfected with the indicated Foxa1 promoter-Luc reporters. Luciferase assay was carried out 24 hours later after the transfection. Experiments were repeated 3 times and the representative data with 3 technical replicates are presented as Mean ± SEM. * , P < 0.05 by Student’s t test.
B C Metastasis Nodules Metastasis Index MCF7: Ctrl Foxa1 Twist1 T+F Supplementary Figure S6. Restored Foxa1 expression increased the expression of most Twist1-suppressed luminal marker genes and decreased the expression of most Twist1-promoted basal marker genes in the xenograft tumors in mice. A. MCF7Ctrl, MCF7Foxa1, MCF7Twist1 or MCF7Twist1+Foxa1 cells were injected into the second pair mammary gland fat pads of each 8-week-old female SCID mouse (4 × 10⁶/fat pad). Five mice were used for each group. Injected mice were fed drinking water containing 1µg/ml of 17β-estradiol. In 6 weeks after cell injection, 5, 4, 9 and 7 tumors were observed in mice receiving MCF7Ctrl, MCF7Foxa1, MCF7Twist1 or MCF7Twist1+Foxa1 cells, respectively. Mice were euthanized and the xenograft tumors were collected. Total RNA samples were prepared from 4 tumors in each group and qPCR analyses were performed to measure the mRNA levels of the indicated luminal and basal marker genes. Their relative expression levels were obtained by normalized to the level of b-actin mRNA in each sample. Four tumor RNA samples in each group were analyzed in duplicates and data are presented as Mean ± SEM. One-Way ANOVA was performed to analyze the statistical differences among groups. * and **, P < 0.05 and 0.001; NS, not significant. B & C. The lungs were isolated from the above mice injected with MCF7Ctrl, MCF7Foxa1, MCF7Twist1 or MCF7Twist1+Foxa1 cells and examined for metastasis by counting the number of metastasis nodules and measuring the ratio of metastatic tumor area to total lung area (Metastasis Index) on the H&E-stained lung sections. MCF7: Ctrl Foxa1 Twist1 T+F
Supplementary Figure S7. Ten-year DMFS curves for luminal A (Panel A), luminal B (Panel B), HER2-positive (Panel C), and basal-like (Panel D) breast cancer patients with different expression levels of Twist1 and Foxa1 mRNAs. The entire cohort was divided into the above four breast tumor subtypes and each subtype group was further divided into Twist1Low/Foxa1High, Twist1High/Foxa1high, Twist1Low/Foxa1Low, and Twist1High/Foxa1Low subgroups by splitting the samples at the median of entire cohort. The sample number (n) for each subgroup is indicated. **, P < 0.01 by Log-rank test.