Download
1 / 50
500 likes | 594 Vues
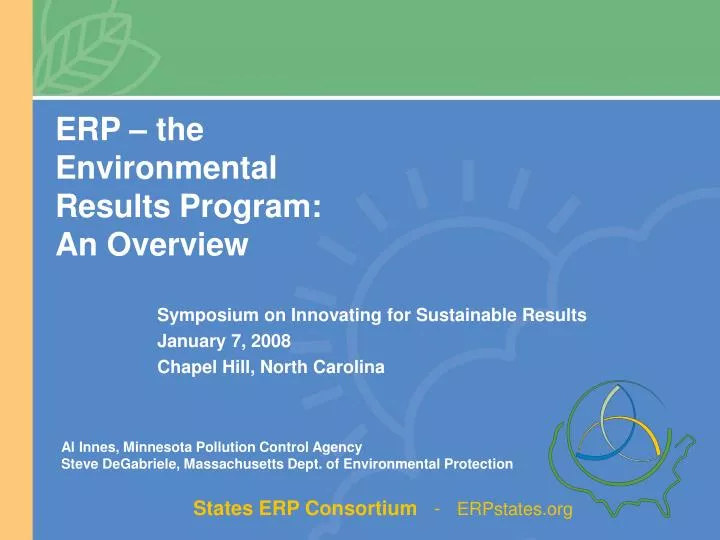
ERP – the Environmental Results Program: An Overview. Al Innes, Minnesota Pollution Control Agency Steve DeGabriele, Massachusetts Dept. of Environmental Protection. Symposium on Innovating for Sustainable Results January 7, 2008 Chapel Hill, North Carolina. What is ERP?.

E N D
ERP – the EnvironmentalResults Program:An Overview Al Innes, Minnesota Pollution Control Agency Steve DeGabriele, Massachusetts Dept. of Environmental Protection Symposium on Innovating for Sustainable Results January 7, 2008 Chapel Hill, North Carolina
What is ERP? • Pioneered by MA DEP in 1990s • Printers, dry cleaners, photo processors • Integrates proven tools to cost-effectively improve performance in sectors characterized by large numbers of small sources of pollution • To date, average initial sector improvements from 5% to 30% • Improvement continues in later years • Stabilizes at high levels
Step 1:Inventory sources (some not previously known) Step 2: Statistical Baseline – random, ID big issues Step 3:Compliance Assistance – trade groups: plain language Step 4: Self- Certification – self-assessment checklist linked to workbooks; compliance certifications; return-to-compliance plans (if necessary) Step 7: InformedResponse - focus on common weaknesses; realign resources Step 5: TargetedFollow-Up – inspections, assistance, enforcement How a “Full” ERP Works: A Typical Cycle Step 6: Statistical Post-Certification – random, verify self-assessment and perf. changes Renew Assistance and Certification (As Deemed Necessary)
ERP: Usually – but not always – for Large Numbers of Small Pollution Sources • Developed by MA in 1990s for printers, dry cleaners and photo processors • Hundreds of facilities per sector • Significant aggregate environmental footprint • Traditional approaches untenable • DEP resources shrinking • ERP sectors have large numbers of facilities nationally • e.g., over 30,000 auto body/paint shops in U. S. • So far, six states with auto body ERPs • Being examined for larger sources now
Variability • Voluntary vs. mandatory • Colorado – larger WWTPs • Subset of tools used • Transferability to new sectors and states • Different basis for authority
Addressing Misconceptions of the Role of Self-Assessment and Reporting in ERP • Sector-wide compliance determination is based primarily on inspection data, not self-reported data • Based on states’ inspection data analyzed to date, group performance has improved across the board • Surprising numbers of facilities self-report noncompliance (83% in MN’s first cycle) • Inaccuracies in self-reported data allow an agency to strategically target its education and enforcement • States retain discretion over when to trust self-reported data and conduct enforcement – as is the case in conventional oversight programs • Self-assessment accuracy appears to improve over time
Current State of ERP • Endorsed for "scale up" by EPA Innovation Action Council (IAC) in 2000 • Based on MA results, NAPA evaluation and potential to address significant problems • Tangible EPA support since then • Grants, technical support, tools and resource flexibility • Expanding number of states and sectors
“Full” ERP Now Covers 11 Sectors/Groups * FL and MD no longer implementing ERP. MD had one ERP that covered both auto body and auto repair shops
“Partial” ERP is Used in Other Sectors “Partial” ERP means the implementing agency is not using the full set of ERP tools
Why Are States Adopting ERP? • Improved resource targeting with rich ERP data sets • Decreased need for enforcement over time • Economies of scale with statistics and automation • Stakeholder measurement demands • Businesses support a more level playing field, clearer obligations • Public supports the often visible improvements • Cost effectiveness
ERP Cost-Effectiveness • Comparisons to conventional compliance programs are difficult since those programs typically do not track sector-wide performance as ERP does • Also, agencies differ widely in how they track cost nevertheless… • ONE study has compared two dry cleaning programs: MA’s ERP and MI’s “census” inspection program, required by MI law • Those under MA ERP appear to perform as well as MI’s • MA’s use of ERP saves about 50% annual FTE compared to MI, allowing those staff resources to be applied elsewhere • MI’s approach eliminates any uncertainty about facility performance • Other states’ experience suggests a similar outcome, once the significant investment in ERP start-up is past • EPA is funding more study of this issue and the Consortium plans to guide its members in analyzing cost-effectiveness
Growing ERP Community Forms a Consortium • States ERP Consortium • Founded 2006 • An official "forum" of the Environmental Council of the States (ECOS) • 18 members (December 2007) • Goals: • Communicating successes to build stakeholder support • Sharing information among practitioners • Expanding support within EPA & promoting ERP as a proven compliance strategy • Improving & disseminating tools for easier automation & measurement
Consortium Membership May 2007
Massachusetts Department of Environmental Protection - Bureau of Waste Prevention Mission Protect public health and the environment. Ensure clean air, clean water and safe waste management. Methods Monitor air quality. Quantifychemical use, pollution and wastes. Regulate facilities and other sources. Promote reuse, recycling and source reduction. Regulated Universe 30,000+ small, 10,000 medium and 600 large sources 300 waste management facilities 4 million+ vehicles and associated transportation infrastructure Use and disposal of consumer products by 6.3 million people and thousands of businesses
ISSUES FOR REGULATORS • How do you effectively and efficiently regulate large groups of facilities or activities with limited resources? • How do you know that your compliance assurance efforts (permits, inspections, compliance assistance, enforcement, etc.) are yielding environmental performance improvements?
1996: Level MA DEP Resources • With major sources generally under adequate controls and oversight, major environmental goals such as Ozone Attainment were still not achieved • Recognition that numerous small sources cumulatively create significant environmental impacts • Build on successful multi-media, pollution prevention based approaches • Less prescriptive, performance-based approaches • Finding better ways to measure regulated community and agency performance • THE ERP APPROACH AND RESULTS
Sector or Activity ( # ) Compliance Assistance Workbooks Self-Certification Statistical Measurement Dry Cleaners (600) X X X Photo Processors (450) X X X Printers (1200) X X X Stage II Vapor Recovery at Refueling Facilities (3000) X X New Small Boilers 10-40BTU (small # / year) X X New Industrial Wastewater Holding Tanks (small # / yr) X Mercury Dentists (3600) X Current Uses of Full ERP & ERP Tools in Massachusetts
BEFORE AFTER 1997 BASELINE UNIVERSE IDENTIFICATION Percentage of facilities “in the system” SINCE 1997
ERP MEASUREMENT METHODOLOGY • EBPI’s • Baseline and Year 1 Random Inspections • Score • Industry-wide • Indicator-specific • Facility-specific • Statistics
EBPI’s for ERP Printers Regulatory Indicators: * Are the fountain solutions used on offset web-fed lithographic presses alcohol-free? (air) * Printer meeting 2ppm or hauling? (water) * Is the facility in compliance with quantity and time limits for HW storage? (waste) Beyond Compliance Indicators: * Does printer have a sign prohibiting discharge of process chemicals over sinks in work areas? (P2) * Does printer recycle aluminum printing plates? (P2)
Percentage of Printers Aggregate EBPI Score PRINTER’S PARTNERSHIPAggregate EBPI Analysis
Photoprocessors EBPI Performance Trends 1997-2002 100% 90% 80% 70% Baseline (1997) Average EBPI: 5.7 60% After 1998 Average EBPI: 7.1 % Photoprocessors 50% After 2000 Average EBPI: 9.6 After 2002 Average EBPI: 9.8 (preliminary data) 40% 30% 20% 10% 0% 0 1 2 3 4 5 6 7 8 9 10 Aggregate EBPI Score
Dry Cleaners EBPI Performance Trends1997-2002 100% 90% 80% 70% Baseline (1997) Average EBPI: 8.4 After 1998 Average EBPI: 8.4 60% After 2000 Average EBPI: 9.7 % of Dry Cleaners 50% After 2002 Average EBPI: 9.8 (preliminary data) 40% 30% 20% 10% 0% 0 1 2 3 4 5 6 7 8 9 10 Aggregate EBPI Score
Dry Cleaners Air Quality (1) Perc Purchases Recorded Monthly (12) Onsite Records of Weekly Leak Checks % Deviation from Baseline Frequency Question (20b) Cycle not ended until temp is < 45 F 1997 vs. 1998 • statistically significant improvement or decline in performance
EBPI PERFORMANCE RESULTS EBPI: Facility Has Emergency Procedures in Place Performance for dry cleaners increased from25% at baseline in 1997 to80% in 1998. Apply this change to the entire universe: 358 more facilities with emergency procedures in place. EBPI: Containers in Good Cond. & Kept Closed Performance decreased by 3% from baseline (or roughly 20 more dry cleaners have inadequate container management). EBPI: Meeting 2ppm Silver Discharge Performance increased from 60% at baseline to 98% in 1998. MA DEP can account for 98% of all silver generated from photoprocessors in Massachusetts.
SELECT ENVIRONMENTAL OUTCOMES • Question: “Are you in compliance with the press cleanup solution requirement?” Results: Performance increased from 77% at baseline in 1998 to 85% in 1999. Apply this to entire universe, this is equivalent to 4.0 tons VOC reduction • Question: “Is leak detection performed weekly, following workbook protocol and using proper leak detection equipment?” Results:Performance increased from 33% at baseline in 1997 to 66% in 2000. Based on avg. perc use per facility, applied to entire universe, this is equivalent to 22.5 ton reduction of perc emissions.
Dry Cleaner Accuracy AnalysisSelf-Certifications vs. Inspections 1% 4% 76% Facility = Y, ( 9 ) Inspector = Y 19% ( 33 ) ( 143 ) 4% Facility = N, Inspector = Y, Facility = N, 1% Inspector = N Facility = Y, 19% Inspector = N 76% ( 580 ) ( ) number of pairs 1997
Stage II Vapor RecoveryGoals and Measures – 1997 - 2005 • Compliance strategy based on ERP approach • Program goal: 9000 tons of VOCs controlled by 3000 fuel dispensing facilities (95% vapor capture efficiency). • Baseline: In 1997, only 54% had submitted required passing vapor system test results. Over 90% field non-compliance. • Program revisions: annual certification to system integrity (tests), weekly operator inspections, systematic reporting enforcement and field inspection presence by DEP • Under revised program, of the 2.7 billion gallons of motor fuel dispensed annually, facilities accounting for 2.65 billion gallons (98%) had certified to passing tests. • In 2005, 8820 tons of VOC demonstrated under control vs. 4860 tons in 1997
Voluntary ERP for Dental Mercury Facilities 2004-2006 • Environmental Footprint: Dental practices generate waste mercury containing amalgam, 3600 dentists, 305-320 pounds of mercury total • Program requirements: Install an amalgam separator; maintain and operate according to manufacturer specs.; use only pH neutral cleaners and clean vacuum system lines; recycle all wastes; keep records; self-certification to DEP • Program incentives and goals: If dental practices certified in 1st year, would not need to upgrade system until 2010. If 50% certified in 1st year, DEP would not promulgate mandatory regulations for at least 1 year • Results: 1,667 dental practices covering 2661 dentists (74% of 3600 total dentists) self-certifiedto requirements
Minnesota Dairy ERP pilot – Phase 1 • Delegated counties • Third-party assesses/certifies • Minnesota Milk Producers Association – Environmental Quality Assurance Program (EQA) • Volunteers, EQA Techs, and County Feedlot Officers • Good results farm-wide • Compliance review aspect of EQA program strengthened • Only modest participation • Resources required to sustain EQA
Minnesota Dairy ERP pilot – Phase 2 • Volunteers in 4 non-delegated counties • Controls in 9 non-delegated counties • Field-test inspection & assessment • Self-assessment approach – Round 1 in March 07 (23 volunteers completed) • Benchmark inspections June-November 07 • Round 2 self-assessments and inspections in 2008
Minnesota Dairy ERP pilot – Phase 2 • Multi-issue, multi-program compliance content • Feedlot rules • Septic systems • Wells • Pesticides • Underground storage tanks • Burn barrels • Beyond-compliance content • Buffers around surface water • Cropping practices • Septic systems • Odor and air emissions • Feed and feed supplements
Minnesota Dairy ERP pilot – Phase 2 status • 25 self-assessments returned by volunteers • 23 volunteers inspected; 2 rejected • Conducted 44 control group inspections • First year (Round 1) data analysis almost complete • Repeat the cycle March thru September 2008 • Compare first and second year data in fall 2008 • End game TBD • State-wide voluntary for smaller feedlots or just some species? • Mandatory as part of 4-year registration cycle (requires rule change)? • Expand into other sectors – auto body/service, USTs, other?
Minnesota Dairy ERP pilot – Phase 2 • Desired Metrics • Compliance status √ • Self/Inspector assessment match rate √ • Partial “MnFARM” (feedlot runoff model) √ soon • Milkhouse pollutants (# cows milking) √ • Acres affected by manure application practices • Acres under sound phosphorus management • Septic pollutants (# residents) • # wells and tanks under sound management √ • Area of buffers • Crop-acres under residue, rotation (√), strip
Minnesota Contrasts for Phase 2 Self-Assessment • Voluntary, pilot – unique seasonality to this sector • Uncertainty over final deployment • 55 of 87 counties have delegated feedlot programs • Natural expansion to beef cattle • Attrition of dairies – generational turnover • Shifts between milking and feeder stock depending on milk, beef, and corn prices • One year is very short for farm improvements ($ limits by law) • No EBPIs (core measures) at the beginning – Round 1 data is suggesting realistic priorities for core improvements we seek • Not quite a “full” ERP, since MN sought lowest cost and greatest accessibility from ERP
ERP States Produce Results • Six states have completed one or more full ERP cycles (8 ERPs) • Across-the-board improvement in first cycle of each ERP • Measured with Environmental Business Practice Indicators (EBPIs), which reflect highest priority compliance and best management practices, e.g.: • DE auto body shops' hazardous waste disposal compliance increased from 66% to 91% in one year • ME auto body shops' use of "green" solvents increased from 46% to 97% in one year
EBPIs Show Significant Net Improvement • 4 EBPIs advancing for every declining EBPI • Size of advances greatly exceeds size of declines
ERP Sector-Level Measures ShowSustained Compliance • FL inspectors found "straight-A" auto repair facilities rose 17 percentage points after two rounds of self-certification • "Straight-A" = No violations of any kind • MA uses a "group compliance score" as its primary measure • Shows the extent to which facilities are achieving EBPIs • Can show improvement, even when facilities are not perfect
Improvements in MassachusettsGroup Compliance Scores Explanatory notes for figure available in ERP 2007 Report and Executive Summary.
Why Do These Improvements Happen? • Mix of Compliance Assistance, Self-Certification and Agency Verification • Plain-language materials help facilities understand requirements • Facilities more capable and driven to improve performance • Facilities hold themselves more accountable • More collaborative, trusting relationship with the agency • Key measure: Return-to-compliance plan submission rate • Surprising numbers of facility self-declared violations • e.g., 20% of all RI auto body shops submitted at least one RTC plan
ERP's Future: New Results, New Sectors • Results expected for new sectors • e.g., USTs, salvage yards, small animal feedlots • New sectors being adopted • e.g., stormwater • Larger sectors being pursued • e.g., thousands of Louisiana oil and gas extraction facilities
ERP's Future: Applying Subsets of Tools • ERP Measurement: Multi-State Common Measures Project • Common indicators for a regulated group (SQGs) and auto body shops • Statistical performance measurement by participants • Allow benchmarking of different policy approaches, across participants • Credible Certification-Only Approaches • Show promise when full ERP not feasible • MA increased control of dental mercury discharges by hundreds of pounds • MA increased control of gas-station VOC emissions by thousands of tons • Self-certification and third-party certification
Want to Learn More about ERP? • Check out "ERP States Produce Results: 2007 Report on States' Experience Implementing the Environmental Results Program." • Executive Summary (May 2007) • 2007 Report (December 2007) • Purpose of Report: • Update the story of ERP • Identify ERP states and sectors • Describe results and other benefits of ERP • Discuss new directions within ERP community • Check out the States ERP Consortium website ERPstates.org
Questions/Discussion Steve DeGabriele, States ERP Consortium Chair (617) 556-1120 steven.degabriele@state.ma.us Al Innes, States ERP Consortium Vice Chair (651) 296-7330 alister.innes@state.mn.us