Download
1 / 16
160 likes | 280 Vues
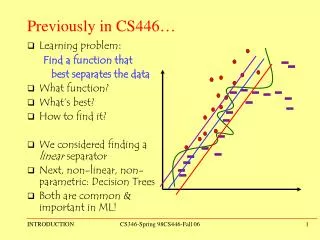
Previously in CS446… . Learning problem : Find a function that best separates the data What function? What’s best? How to find it? We considered finding a linear separator Next, non-linear, non-parametric: Decision Trees Both are common & important in ML!.

E N D
Previously in CS446… • Learning problem: Find a function that best separates the data • What function? • What’s best? • How to find it? • We considered finding a linear separator • Next, non-linear, non-parametric: Decision Trees • Both are common & important in ML! CS346-Spring 98CS446-Fall 06
A Contrast: Decision Trees • We decoupled the generation of the feature space from the learning. • Argued that we can map the given examples into another space, in which the target functions are linearly separable. • Do we always want to do it? • How do we determine what are good mappings? • The study of decision trees may shed some light on this. • Learning is done directly from the given data representation. • The algorithm ``transforms” the data itself. What’s the best learning algorithm? CS346-Spring 98CS446-Fall 06
Decision Trees • A hierarchical data structure that represents data by implementing a divide and conquer strategy • Can be used as a non-parametric classification and regression method. • Given a collection of examples, learn a decision tree that represents it. • Use this representation to classify new examples B A C CS346-Spring 98CS446-Fall 06
Color Blue red Green Shape Shape B triangle circle circle square square B A B C A Decision Trees: The Representation • Decision Trees are classifiers for instances represented as features vectors. (color= ;shape= ;label= ) • Nodes are tests for feature values; • There is one branch for each value of the feature • Leaves specify the categories (labels) • Can categorize instances into multiple disjoint categories – multi-class (color= RED ;shape=triangle) Evaluation of a Decision Tree Learning a Decision Tree CS346-Spring 98CS446-Fall 06
Blue red Green Boolean Decision Trees They can represent any Boolean function. • Can be rewritten as rules in Disjunctive Normal Form (DNF) • green square positive • blue circle positive • blue square positive • The disjunction of these rules is equivalent to the Decision Tree Color • What did we show? Shape Shape + triangle circle circle square square + - - + + CS346-Spring 98CS446-Fall 06
X<3 no yes Y>7 Y<5 no yes yes no X < 1 + - - + + - Decision Trees: Decision Boundaries • Usually, instances are represented as attribute-value pairs (color=blue, shape=square, +) • Numerical values can be used either by discretizing or by using thresholds for splitting nodes. • In this case, the tree divides the feature space into axis-parallel rectangles, each labeled with one of the labels. Y + + + 7 + + - 5 + - - 1 3 X CS346-Spring 98CS446-Fall 06
Outlook Rain Sunny Overcast Humidity Wind High Normal Strong Weak Yes Yes No No Yes Decision Trees • Can represent any Boolean Function • Can be viewed as a way to compactly represent a lot of data. • Advantage: non-metric data • Natural representation: (20 questions) • The evaluation of the Decision Tree Classifier is easy • Clearly, given data, there are many ways to Represent it as a decision tree. • Learning a good representation from data is the challenge. CS346-Spring 98CS446-Fall 06
Representing Data • Think about a large table, N, and assume you want to know something about the people represented as entries in this table. • E.g. own an expensive car or not; older than 28 or not, etc. • Simplest way: Histogram on the first attribute – gender • Then, histogram on first and second (gender & own) N=16 • How many 1-d histograms (contingency tables) are there? 16 • How many 2-d contingency tables? 16-choose-2 = 16 * 15/2 = 120 • How many 3-d tables? 560 • With 100 attributes how many 3-d tables are there? 161,700 • We need to figure out a way to represent data in a better way, and figure out what are the important attributes to look at first. • Information theory has something to say about it – that can be use to better represent the data. CS346-Spring 98CS446-Fall 06
Color Blue red Green Shape Shape + triangle circle circle square square + - - + + Learning Decision Trees • Output is a discrete category. Real valued outputs are possible (regression trees) • There are efficient algorithms for processing large amounts of data. (But not too many features) • There are methods for handling noisy data (classification noise and attribute noise) and for handling missing attribute values. CS346-Spring 98CS446-Fall 06
Day Outlook Temperature Humidity WindPlayTennis 1 Sunny Hot High Weak No 2 Sunny Hot High Strong No 3 Overcast Hot High Weak Yes Outlook 4 Rain Mild High Weak Yes 5 Rain Cool Normal Weak Yes 6 Rain Cool Normal Strong No Rain Sunny Overcast 7 Overcast Cool Normal Strong Yes Humidity Wind 8 Sunny Mild High Weak No 9 Sunny Cool Normal Weak Yes High Normal Strong Weak Yes Yes No 10 Rain Mild Normal Weak Yes No 11 Sunny Mild Normal Strong Yes 12 Overcast Mild High Strong Yes 13 Overcast Hot Normal Weak Yes 14 Rain Mild High Strong No Basic Decision Trees Learning Algorithm • Data is processed in Batch (I.e., all the data is available). • Recursively build a decision tree top-down. Yes CS346-Spring 98CS446-Fall 06
Basic Decision Trees Learning Algorithm • DT(Examples, Attributes) If all Examples have same label: return a leaf node with Label Else If Attributes is empty: return a leaf with majority Label Else Pick an attribute A as root For each value v of A Let Examples(v) be all the examples for which A=v Add a branch out of the root for the test A=v If Examples(v) is empty create a leaf node labeled with the majority label in Examples Else recursively create subtree by calling DT(Examples(v), Attribute-{A}) CS346-Spring 98CS446-Fall 06
Picking the Root Attribute • The goal is to have the resulting decision tree as small as possible (Occam’s Razor) • Finding the minimal decision tree consistent with the data is NP-hard • The recursive algorithm is a greedy heuristic search for a simple tree, but cannot guarantee optimality. • The main decision in the algorithm is the selection of the next attribute to condition on. CS346-Spring 98CS446-Fall 06
A 1 0 B 1 0 - + - A 1 0 - + Picking the Root Attribute • Consider data with two Boolean attributes (A,B). < (A=0,B=0), - >: 50 examples < (A=0,B=1), - >: 50 examples < (A=1,B=0), - >: 0 examples < (A=1,B=1), + >: 100 examples • What should be the first attribute we select? • Splitting on A: we get purely labeled nodes. • Splitting on B: we don’t get purely labeled nodes. • What if we have: <(A=1,B=0), - >: 3 examples CS346-Spring 98CS446-Fall 06
A B 1 1 0 0 100 53 - - B A 1 1 0 0 100 50 3 100 - - + + Picking the Root Attribute • Consider data with two Boolean attributes (A,B). < (A=0,B=0), - >: 50 examples < (A=0,B=1), - >: 50 examples < (A=1,B=0), - >: 0 examples 3 examples < (A=1,B=1), + >: 100 examples • Trees looks structurally similar; which attribute should we choose? CS346-Spring 98CS446-Fall 06
Picking the Root Attribute • The goal is to have the resulting decision tree as small as possible (Occam’s Razor) • The main decision in the algorithm is the selection of the next attribute to condition on. • We want attributes that split the examples to sets that are relatively pure in one label; this way we are closer to a leaf node. • The most popular heuristics is based on information gain, originated with the ID3 system of Quinlan. CS346-Spring 98CS446-Fall 06
In general, when pi is the fraction of examples labeled i: Entropy • Entropy (impurity, disorder)of a set of examples, S, relative to a binary classification is: where is the proportion of positive examples in S and is the proportion of negatives. • If all the examples belong to the same category: Entropy = 0 • If the examples are equally mixed (0.5,0.5) Entropy = 1 Entropy can be viewed as the number of bits required, on average, to encode the class of labels. If the probability for + is 0.5, a single bit is required for each example; if it is 0.8 -- can use less then 1 bit. CS346-Spring 98CS446-Fall 06