Download
1 / 17
170 likes | 171 Vues
Join the South Dakota Demography Conference at South Dakota State University to learn about regional response planning for at-risk, vulnerable, or special populations.

E N D
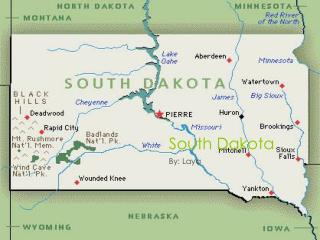
South Dakota Demography Conference May 21-23, 2013 South Dakota State University Jan Clites, BSN, MEd, RN (retired)
South Dakota Department of HealthHospital Preparedness Program (HPP):Partnership ProjectRegional Response Planning forAT-RISK,VULNERABLE, or‘SPECIAL’ POPULATIONS
WHO ARE THE AT-RISK POPULATIONS? Population:% U.S. Population (Census 2000) Children, age 15 & under 22.84 Elderly, age 65 & older 12.43 Non- institutionalized with a Disability, age 16-64 11.78 Speak English ‘not well’ or ‘not at all’ 2.95 TOTAL: 49.99 With addition of entire institutionalized population (e. g. nursing homes, residential facilities, hospitals ) 51.44
At-Risk Populations FOUR (4) CATEGORIES* WITH COUNTY POPULATION DATA 1. Age:Elderly, Children 2. Disability/medically fragile:Vision, Hearing, Substance Abuse, Physical/Mental Illness, Pregnant Women, Pharmacologically Dependent 3. Economic Disadvantage:Unemployed, Homeless, Below Poverty Level 4. Limited Language/Cultural/Geographic Isolation:Non-English Speaking, Hutterite, Native Americans Source: CDC (Center for Disease Control)
Examples of 2010 County Pyramids (Aging and Dependency) Median age: 50 Population density ratio: 5/sq mile Youth dependency ratio: 24 (# of persons 0-14 years per 100 persons 15-64 years) Aged dependency ratio: 34 (# of persons 65+ years per 100 persons 15-64) Aging Index: 141
County Pyramid Examples Youth Dependency Ratio = 22 Aged Dependency Ratio = 13 Aging Index = 61 Youth Dependency Ratio = 31 Aged Dependency Ratio = 20 Aging Index = 65
County Pyramid Examples – Cont’d Youth Dependency Ratio = 53 Aged Dependency Ratio = 10 Aging index = 18 Youth Dependency Ratio = 33 Aged Dependency Ratio = 56 Aging index = 169
Table 2AT-RISK POPULATIONS: Region 3Category: DISABILITY *U.S. Census Bureau data estimated population for 2008. http://quickfacts.census.gov/qfd/states **Renal Network of the Upper Midwest www.esrdnet11.org ***S. D. Department of Human Services, Division of Alcohol and Drug Abuse +SNAPS data derived from the 2000 U.S. Census and several 2003 CDC databases www.bt.cdc.gov/snaps/data
*U.S. Census Estimate Population http://quickfacts.census.gov/qfd/states **Statistical Analysis Report January 2010 S.D. Department of Social Services/Office of Management Information, www.dss.sd.gov ** *SD Statewide 2009 Homeless Count Results/SD Housing Authority ****Data for 5 or less families not published to avoid disclosure of information for particular individuals. *****Bureau of Labor Statistics, U.S.D.A., Economic Research Service
*Information obtained from U.S. Census Bureau 2000; summarized by Mike McCurry Ph.D. SDSU Extension Sociologist. **Colony formed after the 2000 census with estimate of population based on usual split of colonies. Age distribution information not available.
* U. S. Census Bureau data estimated population for 2008 **U.S. Census Bureau 2000 data ***National Center for Education Statistics/number of persons based on estimated (county) population size of persons 16 years and older in households in 2003.
Regional Response Plan Objectives • Maintain individuals in a familiar environment to lessen the traumatic impact of an emergency situations; • Provide support to community-based agencies and organizations who provide direct service to At-Risk Populations; thus, • Minimize additional burden on hospitals and allow for care of those most critically injured/ill
Components of Planning • Identify vulnerable populations • Who represents them (agencies/organizations) • How to reach vulnerable populations • How to transport or provide care