Download
1 / 1
10 likes | 145 Vues
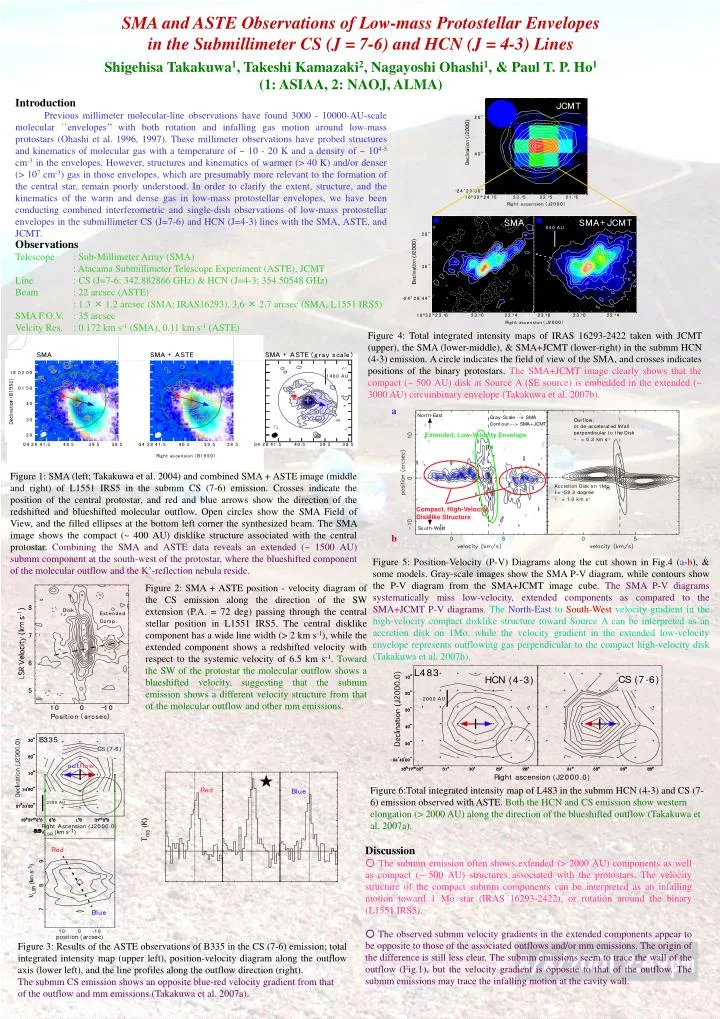
Extended, Low-Velocity Envelope. Compact, High-Velocity Disklike Structure. SMA and ASTE Observations of Low-mass Protostellar Envelopes in the Submillimeter CS (J = 7-6) and HCN (J = 4-3) Lines. Shigehisa Takakuwa 1 , Takeshi Kamazaki 2 , Nagayoshi Ohashi 1 , & Paul T. P. Ho 1

E N D
Extended, Low-Velocity Envelope Compact, High-Velocity Disklike Structure SMA and ASTE Observations of Low-mass Protostellar Envelopes in the Submillimeter CS (J = 7-6) and HCN (J = 4-3) Lines Shigehisa Takakuwa1, Takeshi Kamazaki2, Nagayoshi Ohashi1, & Paul T. P. Ho1 (1: ASIAA, 2: NAOJ, ALMA) Introduction Previous millimeter molecular-line observations have found 3000 - 10000-AU-scale molecular ``envelopes’’ with both rotation and infalling gas motion around low-mass protostars (Ohashi et al. 1996, 1997). These millimeter observations have probed structures and kinematics of molecular gas with a temperature of ~ 10 - 20 K and a density of ~ 104-5 cm-3 in the envelopes. However, structures and kinematics of warmer (> 40 K) and/or denser (> 107 cm-3) gas in those envelopes, which are presumably more relevant to the formation of the central star, remain poorly understood. In order to clarify the extent, structure, and the kinematics of the warm and dense gas in low-mass protostellar envelopes, we have been conducting combined interferometric and single-dish observations of low-mass protostellar envelopes in the submillimeter CS (J=7-6) and HCN (J=4-3) lines with the SMA, ASTE, and JCMT. Observations Telescope : Sub-Millimeter Array (SMA) : Atacama Submillimeter Telescope Experiment (ASTE), JCMT Line : CS (J=7-6; 342.882866 GHz) & HCN (J=4-3; 354.50548 GHz) Beam : 22 arcsec (ASTE) : 1.3 × 1.2 arcsec (SMA; IRAS16293), 3.6 × 2.7 arcsec (SMA, L1551 IRS5) SMA F.O.V. : 35 arcsec Velcity Res. : 0.172 km s-1 (SMA), 0.11 km s-1 (ASTE) Figure 4: Total integrated intensity maps of IRAS 16293-2422 taken with JCMT (upper), the SMA (lower-middle), & SMA+JCMT (lower-right) in the submm HCN (4-3) emission. A circle indicates the field of view of the SMA, and crosses indicates positions of the binary protostars. The SMA+JCMT image clearly shows that the compact (~ 500 AU) disk at Source A (SE source) is embedded in the extended (~ 3000 AU) circumbinary envelope (Takakuwa et al. 2007b). a Figure 1: SMA (left; Takakuwa et al. 2004) and combined SMA + ASTE image (middle and right) of L1551 IRS5 in the submm CS (7-6) emission. Crosses indicate the position of the central protostar, and red and blue arrows show the direction of the redshifted and blueshifted molecular outflow. Open circles show the SMA Field of View, and the filled ellipses at the bottom left corner the synthesized beam. The SMA image shows the compact (~ 400 AU) disklike structure associated with the central protostar. Combining the SMA and ASTE data reveals an extended (~ 1500 AU) submm component at the south-west of the protostar, where the blueshifted component of the molecular outflow and the K’-reflection nebula reside. b Figure 5: Position-Velocity (P-V) Diagrams along the cut shown in Fig.4 (a-b), & some models. Gray-scale images show the SMA P-V diagram, while contours show the P-V diagram from the SMA+JCMT image cube. The SMA P-V diagrams systematically miss low-velocity, extended components as compared to the SMA+JCMT P-V diagrams.The North-EasttoSouth-Westvelocity gradient in the high-velocity compact disklike structure toward Source A can be interpreted as an accretion disk on 1Mo, while the velocity gradient in the extended low-velocity envelope represents outflowing gas perpendicular to the compact high-velocity disk (Takakuwa et al. 2007b). Figure 2: SMA + ASTE position - velocity diagram of the CS emission along the direction of the SW extension (P.A. = 72 deg) passing through the central stellar position in L1551 IRS5. The central disklike component has a wide line width (> 2 km s-1), while the extended component shows a redshifted velocity with respect to the systemic velocity of 6.5 km s-1. Toward the SW of the protostar the molecular outflow shows a blueshifted velocity, suggesting that the submm emission shows a different velocity structure from that of the molecular outflow and other mm emissions. Figure 6:Total integrated intensity map of L483 in the submm HCN (4-3) and CS (7-6) emission observed with ASTE. Both the HCN and CS emission show western elongation (> 2000 AU) along the direction of the blueshifted outflow (Takakuwa et al. 2007a). Discussion ○ The submm emission often shows extended (> 2000 AU) components as well as compact (~ 500 AU) structures associated with the protostars. The velocity structure of the compact submm components can be interpreted as an infalling motion toward 1 Mo star (IRAS 16293-2422), or rotation around the binary (L1551 IRS5). ○ The observed submm velocity gradients in the extended components appear to be opposite to those of the associated outflows and/or mm emissions. The origin of the difference is still less clear. The submm emissions seem to trace the wall of the outflow (Fig.1), but the velocity gradient is opposite to that of the outflow. The submm emissions may trace the infalling motion at the cavity wall. Figure 3: Results of the ASTE observations of B335 in the CS (7-6) emission; total integrated intensity map (upper left), position-velocity diagram along the outflow axis (lower left), and the line profiles along the outflow direction (right). The submm CS emission shows an opposite blue-red velocity gradient from that of the outflow and mm emissions (Takakuwa et al. 2007a).