Download
1 / 24
240 likes | 371 Vues
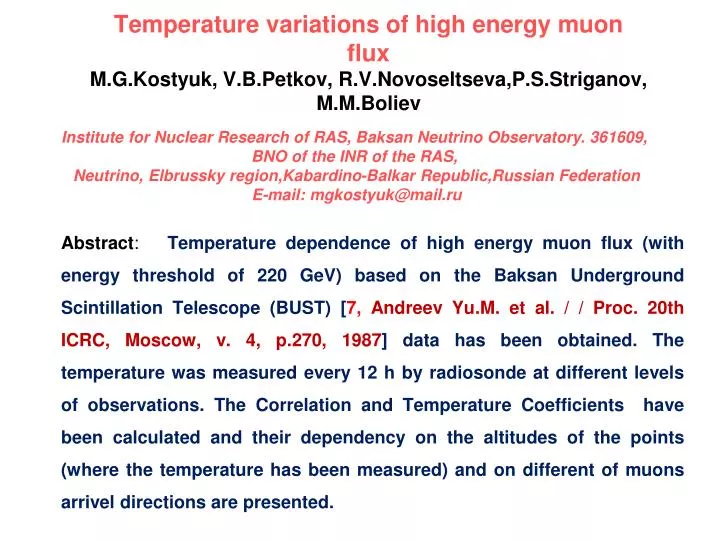
Institute for Nuclear Research of RAS, Baksan Neutrino Observatory. 361609, BNO of the INR of the RAS, Neutrino, Elbrussky region,Kabardino-Balkar Republic,Russian Federation E-mail: mgkostyuk@mail.ru.

E N D
Institute for Nuclear Research of RAS, Baksan Neutrino Observatory. 361609, BNO of the INR of the RAS, Neutrino, Elbrussky region,Kabardino-Balkar Republic,Russian Federation E-mail: mgkostyuk@mail.ru Temperature variations of high energy muonfluxM.G.Kostyuk, V.B.Petkov, R.V.Novoseltseva,P.S.Striganov,M.M.Boliev Abstract:Temperature dependence of high energy muon flux (with energy threshold of 220 GeV) basedon the Baksan Underground Scintillation Telescope (BUST) [7, Andreev Yu.M. et al. / / Proc. 20th ICRC, Moscow, v. 4, p.270, 1987]data has been obtained.The temperature was measured every 12 h by radiosonde at different levels of observations.The Correlationand TemperatureCoefficients have been calculated and their dependency on thealtitudes of the points (where the temperature has been measured) and on different of muons arrivel directions are presented.
Large underground detectors as MACRO: [2, Ambrosio M. et al. (MACRO collaboration). / / Astrop.Phys. 1997. V. 24. P. 109. ]; AMANDA: [3, Bouchta A. et al. (AMANDA collaboration). / / Proceedings of the ICRC99. HE.3.2.11.]; MINOS [4, Grashorn E.W. et al. (MINOS collaboration. / / Proceedings of the ICRC07. (ArXiv: 0710.1616).]; LVD [5, Agafonova N.J. et al / / 31-I VKKL, Moscow State University, 2010 MN / MN _14.] analyze seasonal variations in the flux of high-energy muons. It was showed that the period of variation is equal to one year. The maximum and minimum of the muon flux fall in July and January, respectively (in the northern hemisphere).
1.Behavior of the counting rate of muons (CRM) for BUST and temperature at specific points of the atmosphere Time variations of the CRM for BUSTsuggests a natural to explore its correlation with the time variation of temperature in different locations on the atmosphere. Fig. 1shows a typical behavior of the CRM for BUST(2008). Fig. 2,3,4showsthe scattering of points corresponding to CRM and the temperature(2008). The temperature data (in degrees centigradeon the horizontal axis) correspond to different heights of 37054 URMM Mineralnye Vody Observationsat which an interval of time being 12 hours. Data on CRM on the vertical axis correspond to the counting rate in 1 min with a resolution of 12 hours. The quantitative values are shown directly on the graphs (including the correlation coefficients). The temperature data were taken at the site: http://weather.uwyo.edu/upperair/sounding.html.
Fig.1.Typical behavior of the counting rate of muons, thehorizontal axis represents the number of 15-minute interval of time (as a whole in 2008) and vertical axis: CRM, divided by 1 minute with a resolution of 15 min.
Fig.2. The scattering of points corresponding to CRM and the temperature ( at height being equal to 5000 m) for the 2008 year.
Fig.3.The scattering of points corresponding to CRM and the temperature (at height being equal to12500 m) for the 2008 year.
Fig.4.The scattering of points corresponding to CRM and the temperature( at height being equal to 15000 m ) for the 2008 year.
On Fig.5 is showed the CRM, where the horizontal axis represents a number of 12 hour interval of 2008 year, and the vertical axis - counting rate of muons for 15 min, corresponding to the half a day beginning.Fig.6shows a typical time variation of the temperature in time. A brief survey of the last four graphs shows any dependency of the correlation coefficients CRM and temperature with increasing altitude. This fact indicates the need for further analysis of this kind of correlations, in particular, search on what heights the correlation is maximal and how this relates to the intensity of muon production for different altitudes.
Fig.5. The horizontal axis represents a number of 12 hour interval of 2008 year, and the vertical axis - counting rate of muons for 15 min, corresponding to the half a day beginning.
Fig.6. Time variation of temperature (at height being equal to 10000 m) for 2008 year. The horizontal axis represents a number of 12 hour interval of 2008 year, the vertical axis – temperature (in degrees centigrade) corresponding to the half a day beginning.
Fig. 7presents the dependence of correlation coefficients K on altitude H. The altitude (in kilometers) of the point near Mineralnye Vody where temperature was measured is plotted values of the corresponding correlation coefficient. Correlation coefficient K change non-monotonicallyas a function of altitude H. The well-pronounced minimum is observed in the region of 15–20 km, and the well-pronounced maxima neighborhood of 12 and 25 km correspondingly. The numerical discrepancy between the values of the correlation coefficients is apparently due to our analyzing correlations (as opposed to the procedure in [7]: for the data obtained over a five-month period and averaged over a day ). The tendency of the correlation coefficient to go through a minimum with variation of the altitude is identical in this work and in [7], as can be seen in Fig. 7. Fig. 7. The Correlation Coefficient dependency on the height of the atmosphere point The black squares in Fig. 2 correspond to the correlation coefficients obtained in [7, Andreev Yu.M. et al. / / Proc. 20th ICRC, Moscow, v. 4, p.270, 1987].
3. CRM and temperature (at different altitude of points of the atmosphere) Correlation Analysis (as a function of the solid angle corresponding different cosine of the zenith angle and all azimuth ones) The BUST underground muon intensity depends on the threshold energy and the cosine of the zenith angle. The Correlation Coefficient and Temperature Coefficient dependency on the height of the atmosphere point for equal solid anglesof corresponding different directionshas been investigated. Solid angles correspond intervals between seven values of cosine of zenith angleɵaccording to formula: cos(ɵj) =(6-j)/6, where j =0,1,2,3,4,5,6.
Evaluation of the Temperature Coefficient was carried out at the assumption that CRM variations is described as where T is the temperature (K). Correlation and Temperature Coefficients C and can be calculated as where Ti are the values of the temperature of the a half of the day beginning, the values Ii is one day, one hour, a half of the hour averaged quantity (see corresponding Figures), T andIare corresponding mean values for 2008 year.
Fig. 8. The Correlation Coefficient dependency on the height of the at\mosphere point, CRM data are one day averaged.Curve 1: integral CRM;curve 2-6: (6-j)/6<cos(theta)<(6-j+1)/6; j=1,2,3,4,5; Zenith angle increasing lead to the increasing of the depth of muon arrival, what lead to more high effective threshold of muon recording, as aconsequence, statistics decreases. The curves shows corresponding decreasing of the values of the Correlation Coefficients.
Fig. 9. The Correlation Coefficient dependency on the height of the atmosphere point,CRM data are one hour averaged.Curve 1: integral CRM;curve 2-6: (6-j)/6<cos(theta)<(6-j+1)/6; j=1,2,3,4,5. Zenith angle increasing lead to the increasing of the depth of muon arrival, what lead to more high effective threshold of muon recording, as aconsequence, statistics decreases. The curves shows corresponding decreasing of the values of the Correlation Coefficients. • Azimuthal angle increasing
Fig. 10. The Correlation Coefficient dependency on the height of the atmosphere point, CRM data are a half of the day averaged.Curve 1: integral CRM;curve 2-6: (6-j)/6<cos(theta)<(6-j+1)/6; j=1,2,3,4,5. Zenith angle increasing lead to the increasing of the depth of muon arrival, what lead to more high effective threshold of muon recording, as aconsequence, statistics decreases. The curves shows corresponding decreasing of the values of the Correlation Coefficients.
Fig. 11. The Temperature Coefficient dependency on the height of the atmosphere point, CRM data are one day averaged.Curve 1: integral CRM;curve 2-6: (6-j)/6<cos(theta)<(6-j+1)/6; j=1,2,3,4,5. Zenith angle increasing lead to the increasing of the depth of muon arrival, what lead to more high effective threshold of muon recording, as aconsequence, statistics decreases. The curves shows corresponding decreasing of the values of the Temperature Coefficients.
Fig. 12. The Temperature Coefficient dependency on the height of the atmosphere point, CRM data are one hour averaged. Curve 1: integral CRM;curve 2-6: (6-j)/6<cos(theta)<(6-j+1)/6; j=1,2,3,4,5. Zenith angle increasing lead to the increasing of the depth of muon arrival, what lead to more high effective threshold of muon recording, as aconsequence, statistics decreases. The curves shows corresponding decreasing of the values of the Temperature Coefficients. • Azimuthal angle increasing
Fig. 13. The Temperature Coefficient dependency on the height of the atmosphere point , CRM data are a half of the day averaged.Curve 1: integral CRM;curve 2-6: (6-j)/6<cos(theta)<(6-j+1)/6; j=1,2,3,4,5. Zenith angle increasing lead to the increasing of the depth of muon arrival, what lead to more high effective threshold of muon recording, as aconsequence, statistics decreases. The curves shows corresponding decreasing of the values of the Temperature Coefficients. Figures 8,9,10,11,12,13shows that the maximal values of the Correlation Coefficients decreases (but not for Temperature Coefficient) if a interval of averaging decreases too (leading to decreasing of statistics).
Fig. 14. Time variation of temperature (at heights being equal to 12.5, 17.5, 25.0 km correspondingly), horizontal axis represents a number of 12 hour interval of 2008 year. The magnitude of temperature variation corresponding to minimum of the Correlation or Temperature Coefficients as a function of the altitude is a half of the magnitude corresponding to maxima of this values.
Figures 8,9,10and 11,12,13 shows us the behavior of the Correlation Coefficient and Temperature Coefficient as a function of the height of the atmosphere point for equal solid angles corresponding different directions. As one can see, Correlation Coefficient dependency manifest a minimum (17.5 km) and maxima (12.5 and 25 km) for all directions and for all resolutions. This phenomenon may be related to the relatively slowly temperature variation in time ( the height being equal to 17.5 km, corresponding the minimum of the Correlation Coefficient height dependency ) against relatively significant of this dependency corresponding the maxima ( the heights being equal to12.5 and 25 km correspondingly). The minima of the Correlation and Temperature Coefficients as a function of the height correspond to atmosphere tropopause and maxima are related to troposphere and stratosphere correspondingly (see Figures 8,9,10 and 11,12,13 ).
Conclusion • Correlations between the rate of counting of high-energy muons on BUST and the temperature of the atmosphere in remote locations are investigated. • The behavior of the Correlation and Temperature Coefficients as a function of the point height of the atmosphere (where the temperature was measured)have been presented for different directions at which muons come to BUST. • Maximal values of the Correlation Coefficients decreases if a statistics decreases too. • The minima of the Correlation and Temperature Coefficients as a function of the height correspond to atmosphere tropopause and maxima are related to troposphere and stratosphere correspondingly.
Minimum and maxima of the Correlation and Temperature Coefficients as a function of the height are related to the magnitude of the temperature variation for this altitude. The magnitude of temperature variation corresponding to minimum is approximately a half of the magnitude corresponding to maxima. • The values of the Correlation and Temperature Coefficients neighborhood of the minimum are approximately a half of the corresponding values neighborhood of the minima. • The values of the Correlation and Temperature Coefficients neighborhood of the minimum are approximately a half of the corresponding values neighborhood of the minima.
REFERENCES • 1. Dorman L.I. Meteorological effects of cosmic rays. Moscow: Nauka, 1972. • 2. Ambrosio M. et al. (MACRO collaboration). / / Astrop.Phys. 1997. V. 24. P. 109. • 3. Bouchta A. et al. (AMANDA collaboration). / / Proceedings of the ICRC99. HE.3.2.11. • 4. Grashorn E.W. et al. (MINOS collaboration. / / Proceedings of the ICRC07. (ArXiv: 0710.1616). • 5 . Agafonova N.J. et al / / 31-I VKKL, Moscow State University, 2010 MN / MN _14. • 6. Alexeyev E.N. et al. / / Proc. 16th ICRC, Kyoto, v.10, p.276, 1979. • 7. Andreev Yu.M. et al. / / Proc. 20th ICRC, Moscow, v. 4, p.270, 1987. • 8. Volkova L.V.// Yad, vol.12, p. 347, 1970.