Download
1 / 16
170 likes | 326 Vues
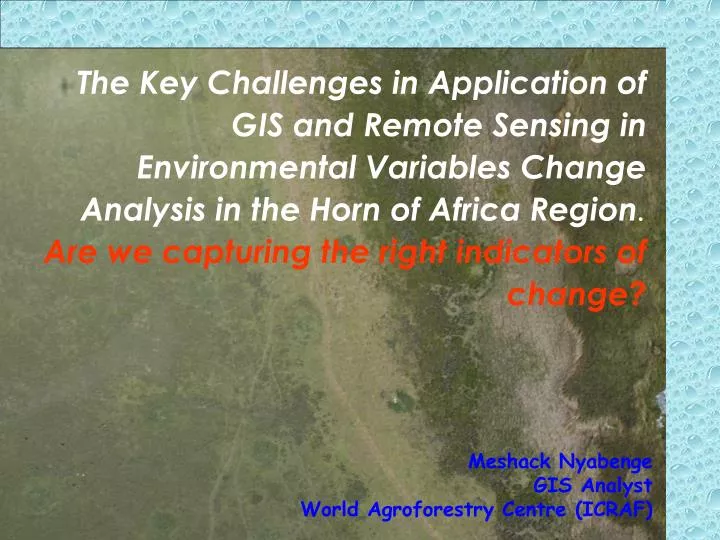
The Key Challenges in Application of GIS and Remote Sensing in Environmental Variables Change Analysis in the Horn of Africa Region . Are we capturing the right indicators of change?. Meshack Nyabenge GIS Analyst World Agroforestry Centre (ICRAF). Content. Introduction

E N D
The Key Challenges in Application of GIS and Remote Sensing in Environmental Variables Change Analysis in the Horn of Africa Region.Are we capturing the right indicators of change? Meshack Nyabenge GIS Analyst World Agroforestry Centre (ICRAF)
Content • Introduction • Challenges in the context of:- • Project planning vs. Ideal data requirements • Ideal data requirements vs. RS data available • Project output vs. Data interpretation methods and tools • Summary of key problems • Discussion
Introduction • Despite the enormous global investments in GIS and remote sensing, detailed and diversified methods and tools developed for different applications in the last three decades, developing countries still faced with frequent environmental related risks and calamities. • The total global market expenditures for remote sensing products were more than $7 billion in 2006 and should reach almost $7.3 billion in 2007. At a compounded annual growth rate (CAGR) of 6.3%, the market will reach more than $9.9 billion by 2012 (Electronics Industry Market Research and Knowledge Network 2007) • GPS production value globally is expected to grow to $21.5 billion in 2008, up from $13 billion in 2003, according to the Industrial Economics and Knowledge Center (IEK) of the Industrial Technology Research Institute (ITRI) • The confluence of those three technologies - GIS, remote sensing and GPS - led many analysts to predict that a powerful new industry was about to be born. Some boldly predicted it would surpass $30 billion in sales by 2005. • This translates to availability of these resources to civilian use as opposed to initial development dates. • GIS for examples has realized entry open sources software and tools not only targeting specific applications, but also accessible various users communities. • Remote sensing equally has gained a lot entry of new products like RADARSAT, ASTER, Quickbird, IKONOS, etc, This variety has brought high resolution satellite products, cheap and affordable imagery for different applications.
Common environmental problems • Frequent floods within major river basins • Continuous drying up of lakes within major catchment • Unpredicted drought resulting in livestock and human deaths • Frequent forest fires affecting forest related biodiversity
What are major causes of these problems? • Climate change • High rapid growth of human population linked poverty • Poor formulated policies in natural resource utilization. • etc What are the response from institutions within horn of Africa? • Emergence of many Research and Development projects addressing environment and sustainable natural resource management • Formation of many NGOs, CBOs and NARs handling specific components of environmental issues. • Reviews of new policies and legislative acts directly touching key environmental components. • etc GIS and Remote Sensing are continuously used to supplement and complement these programs both at national to local level
What are the challenges? This presentation uses 4 projects to review variety of challenges encountered 1.Evaluating Landuse changes effects on river flow using USGS steam flow model in Mara river basin (Mutie SM et al (2006) 2. Changes in Forest cover of the Mau forest in Kenya between 1973-2005 and a survey of recent initiatives to restore forest functions (David Lowery 2006)
What are the challenges? This presentation uses 4 projects to review variety of challenges encountered 3. Post Conflict Environmental Assessment for Sudan(ICRAF-UNEP (2006) 4.Rainwater Harvesting innovations in response to water scarcity, The Lare Division experience(RELMA-ICRAF(2005)
1.Evaluating Land use changes effects on river flow using USGS steam flow model in Mara river basin (Mutie SM et al (2006)
2. Changes in Forest cover of the Mau forest in Kenya between 1973-2005 and a survey of recent initiatives to restore forest functions (Lowery 2006)
3.Post Conflict Environmental Assessment for Sudan (ICRAF-UNEP, 2006)
4. Rainwater Harvesting innovations in response to water scarcity, The Lare Division experience
Summary of Challenges • Project planning does not cater for idea RS data requirements against keys researchable environmental variable in terms of temporal, spectral and spatial (Little money is put RS data). • Little attempt is made supplement Landsat, SPOT or ASTER or Quickbird with low resolution images (MODIS, NOAA) to support and stratify broad scale landscape change. • Limited use of better pre-processing and post-processing tools (atmospheric correction, etc) to refine RS data quality to depict the researched environmental variables changes • Minimum use of diversified tools within new software like Ecognition, TNT mips, ENVI,other open source software like DIVA, SPRING, among to complement data interpretation is evident.
Conclusion Are we capturing the right indicators of change? Discuss!