Download
1 / 23
230 likes | 346 Vues
Multi-parameter Water-Quality Probes (YSI/Hydrolab). Lecture 5. Retrieval. Rinse in freshwater (fill sensor cup). If heavy fouling add 1-2% bleach Do post calibration next day BEFORE cleaning thoroughly. Download data file to EcoWatch software. Export to XL or stats package.

E N D
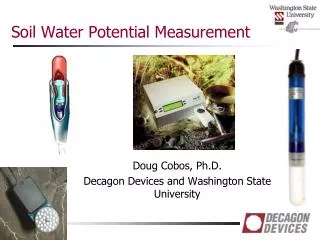
Multi-parameter Water-Quality Probes (YSI/Hydrolab) Lecture 5
Retrieval • Rinse in freshwater (fill sensor cup). • If heavy fouling add 1-2% bleach • Do post calibration next day BEFORE cleaning thoroughly. • Download data file to EcoWatch software. • Export to XL or stats package
Data problems • Check battery voltage – no power, no data • Conductivity cell – fouling causes salinity to decrease over time • NTU and CHL sensors fouling over optic window. Bubbles cause SPIKES. • Clark DO probe fails under prolonged hypoxia (10-14 days) as all KCl used up. • pH well buffered, should not change much • Low tides may cause air exposure…
Summary statistics • Min and Max (good for weeding out obviously bad data (e.g. neg salinity) • Range (=max – min) • Mean (=average) • Standard deviation (=stdev) – msr of variability • Coeff Variation (=stdev/mean*100) – msr of variation as percentage of mean. 5% is generally accepted in lab work.
Set data in biological context • Min-Max of range (optimal, lethal) • # days in suitable range • Periodicity of optimal, suboptimal conditions – stress:recovery • NEED TO KNOW ABOUT YOUR ORGANISM!
Lab • Clean YSI retrieved from Pier • Download data • Explore data in Ecowatch • Export data as *.csv file • Import data into Excel • Check for errors/bad data – flag these • Calculate summary statistics
GCRL pier data http://sites.google.com/site/drcgrass/home/water-quality-monitoring
The problem • Time series data – high frequency, but few points. • Need to create a “map” – very easy for humans to interpret (even non-scientists!) • Spatial Interpolation – a geostatistical method.
Spatial Interpolation • Interpolation is defined as the method of predicting values for a whole surface based on sample point values. The assumptions are that the values occur on the whole surface, i.e. they are continuous and not discrete, and that they are spatially related to the surface properties. Spatial interpolation is used to estimate a value of a variable at an unsampled location from measurements made at other sites within a defined area. Interpolation is based on the principle of spatial dependence which measures the degree of dependence between near and distant objects.
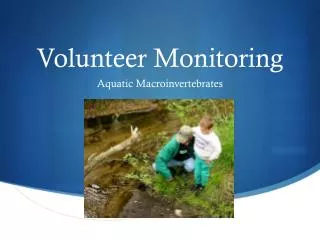
Zostera & Halodule Monitoring Upper • Turbidity/Color gradient • 3 regions along gradient • Middle+Lower region has seagrass • 3 Stns per region • Sampled 1 day/mo. • Water - chl a/TSS/C-DOM • LiCor+YSI profile (0.5m inc.) • Secchi depth • 1 “Permanent” Stn per region • Sample each quarter for a month • Mar., Jun., Sept, Dec 2003. • LiCor (5min) and YSI (30min) @ 1m depth. Middle Lower
Client tools! Table 1: Threshold concentrations for three water-quality components, calculated from measured optical properties in North River, NC in 2003. Clients will include federal, state and local environmental agencies and water quality monitoring organizations with an interest in protecting seagrass as EFH. Can also include research and education organizations.
Summary • Need to check data – manually or develop routines (macros). • Generate summary statistics – compare to species of interest / threshold criteria • Map data if enough points exist. • Map regions of concern based on criteria.