Download
1 / 36
360 likes | 512 Vues
THE. ROLAP DATA FLOWS SCHEMA DATA MINING FORENSICS HOLAP NETWORK SECURITY ONLINE ANALYSIS MOLAP STREAMING DATA MULTI-DIMENSIONAL HIERARCHIES CUBOID BINARY TREE FOREST SQL GROUP BY DATA CUBE RELATIONAL ALGEBRA OLTP OLAP LATTICE NOTATION. Stephen A. Broeker. Acronyms.

E N D
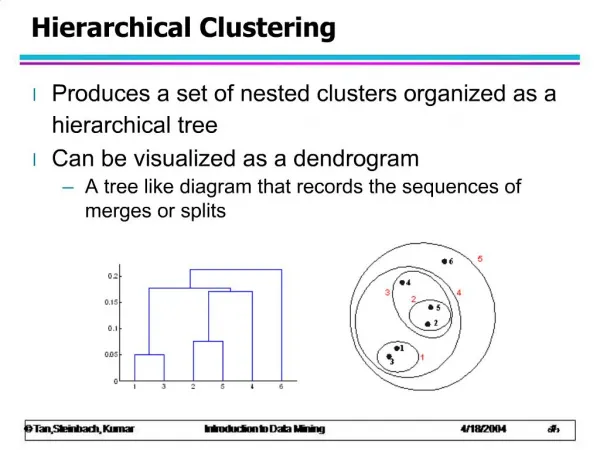
THE ROLAP DATA FLOWS SCHEMA DATA MINING FORENSICS HOLAP NETWORK SECURITY ONLINE ANALYSIS MOLAP STREAMING DATA MULTI-DIMENSIONAL HIERARCHIES CUBOID BINARY TREE FOREST SQL GROUP BY DATA CUBE RELATIONAL ALGEBRA OLTP OLAP LATTICE NOTATION • Stephen A. Broeker
Acronyms • OLAP – Online Analytical Processing • OLTP – Online Transaction Processing
Conclusion • DATA VALUE HYPERCUBES exceed the performance of existing hypercubes by enabling OLAP to drill down to individual data values. • Therefore, DATA VALUE HYPERCUBES extend OLAP’s ability to render valuable information and insight.
Vision • Analyze Streaming Data • Improve Network Security • Freedom from figuring out how to answer routine questions in order to think about what extraordinary questions could be asked.
Mutually Exclusive Approaches OLAP OLTP Broad views of data: Finds patterns obscured by detail. Narrow views of data: Finds detail obscured by patterns.
Distinct Purposes OLAP Online Analytical Processing Seeks detailed answers to complex questions based on large data sets. Discover information hiding in data. The priority is depth and breadth of understanding, speed is secondary. Example: Find the purchase patterns for men for all dental hygiene products in all stores. OLTP Online Transaction Processing Operate and Control: Snapshots of operational status. The priority is speed & detail. Example: John Smith used a debit card to buy toothpaste from a gas station.
Opportunity VS VS VS VS • Eliminate the mutually exclusive tradeoff between OLTP versus OLAP. Now we can have the best of both worlds. Today. Tomorrow.
Capability ofthe Data Value Hypercube • Enables the composition of totals from aggregates or data values. • Detect trends and tendencies among measures, attributes or parameters. • Find a “Needle in Haystack” by drilling-down to specific details. • Spot data clusters, relationships and magnitudes of size, disparity, or distribution. • Detect outliers, anomalies, exceptions, and data errors.
Data Mining • Data Mining uses OLAP. • Example: Associations • People who buy bread “also” buy ‘X’. • “Also” is presented as a percentage. • Building a Data Warehouse: $1M • Building a DBMS Team: $2M • Having confidence in your results: Priceless.
Compare Roles OLTP Relational Database DATA VALUES OPERATIONS BUSINESS INTELLIGIENCE Data Warehouse DATA AGGREGATES OLAP
Compare OLTP to OLAP Compare OLTP to OLAP
Hypercube Hypercubes are constructed so that each cell corresponds to a unique combination of database attribute values.
Dependencies OLAP Engines areimplemented as multi-dimensional data cubes. Data cubes with many dimensions are called hypercubes.
Disambiguation Rotating 4D Cube In geometry, the tesseract is the four-dimensional analog of the cube. The tesseract is to the cube as the cube is to the square. A generalization of the cube to dimensions greater than three is called a “hypercube”. Created by Jason Hise with Maya and Macromedia Fireworks. A 3D projection of an 8-cell performing a [[SO(4)#Geometry_of_4D_rotations|single rotation]] about a plane which bisects the figure from front to back and top to bottom. Released by the author into the public domain: Jason Hise grants anyone the right to use this work for any purpose, without any conditions, unless such conditions are required by law.
In this context, hypercubes are data structures. This picture ismerely an abstract visual representation of a hypercube. Disambiguation
Concepts versus Implementation Implementation Later • A Balanced B-Tree Forest is the data structure that is used to represent a Hypercube. • Each dimension in the Hypercube is represented by a separate B-Tree. CONCEPTS FIRST
Hypercubes Have Dimensions Part Customer Supplier
Part 4 Part 3 Part 2 Part 1 Customer A Supplier4 Customer B Supplier 3 Customer C Supplier2 Customer D Supplier 1 Attributes Ordered into Hierarchies
Jan Feb Mar Apr May June July August September October November December Monday Tuesday Wednesday Thursday Friday Saturday Sunday 2011 2010 2009 2008 Multiple Attributesin a Single Dimension Dimensions are organized as hierarchies of attributes. Example, the time dimension of Year, Month, Day Drill-down is viewing data at progressively finer detail. Example: Sales per year, then month, then day. Roll-up is viewing data in progressively less detail. Example: Sales per day, then month, then year. UP DOWN
Jan Feb Mar Apr May June July August September October November December Monday Tuesday Wednesday Thursday Friday Saturday Sunday 2011 2010 2009 2008 Attribute Complexity Attribute complexity increases in the presence of hierarchies. Example, queries that group on time. These queries, (day), (month), (year), each represents a different granularity of the time dimension. (year) <= (month) <= (day) If we have total sales grouped by month, then we can use the results to compute the total sales grouped by year.
Jan Feb Mar Apr May June July August September October November December Monday Tuesday Wednesday Thursday Friday Saturday Sunday 2011 2010 2009 2008 Query Dependencies Hierarchies introduce query dependencies that we must account for when determining what queries to materialize. Often, hierarchies are not total orders, but partial orders on the attributes that make up a dimension. Example: Months and years cannot be divided evenly into weeks. If we group by week then we can’t determine the grouping by month or year. (month) !<= (week), (week) !<= (month), and similarly for week and year.
Limit of the Visual Analogy • Although mathematicians can project geometric shapes having at least 10 dimensions onto a flat surface beyond 3 dimensions, the visual analogy of a hypercube as a data structure stops working, even though the logic of the analogy remains perfectly valid. • The construction of 4 dimensional hypercube on a flat surface makes it obvious why we don’t go beyond 3D representations.
Cuboids This is a single data cell.
Cuboids Any subset of a hypercube isa cuboid.
Cuboids Slice. A subset of a hypercube corresponding to a single value.
Cuboids Dice. A slice on more than one dimension, or consecutive slices.
Cuboids Also a dice.
Drilling down. Detailed information.
Rolling up More Detail Narrower Summaries Less Detail Broader Summaries
Challenges • Large databases • Data in a rapid and constant state of flux, i.e., streaming data. • Constraints: Time, RAM, computing power • Data Cube Materialization is problematic.
Predicted % Change to Data Warehouse Feeds Multi-Dimensional Databases Instant Messaging XML Email RSS Legacy Databases +80% -80% Content Management EDI Web Pages Spreadsheets Voice recognition Main Frame Databases Web Log Relational Databases Document Management Wikis Taxonomies, Ontologies OLAP Multimedia • UNSTRUCTURED • DATA • STRUCTURED • DATA OLTP
Bottleneck +1 Number of Cells in a Data Cube Given a database withlnumber of attributes, the number of cells in the corresponding fully populated data cube is1≤ i ≤ l(ai+1)where each attributei has aivalues. The additional data cell accommodates the value “all”.
Cuboid Example Consider a network hypercube with 3 dimensions: • Content • Source IP • Time Stamp Limit the hypercube to one million streams. Typically there are: • 201 unique Content types • 100 unique Source IPs • 275 unique Time-Stamps the number of possible cells is: = 202 x 101 x 276 ≈ 5.8 million In actuality, the network data stream has16 dimensions.
Data Expansion B B 20 Dimensions 15 Dimensions Oceans of Data 10 Dimensions Number of Cells Note: Log Scale 5 Dimensions 5 10 15 20 Unique Data Values per Dimension