Download
1 / 24
240 likes | 356 Vues
Local Climate Analysis Tool (LCAT). Marina Timofeyeva and Fiona Horsfall National Weather Service Climate Services Division September 2012. What is the Local Climate Analysis Tool (LCAT)?. Developed originally to support NWS field offices Online interactive tool

E N D
Local Climate Analysis Tool (LCAT) Marina Timofeyeva and Fiona Horsfall National Weather Service Climate Services Division September 2012
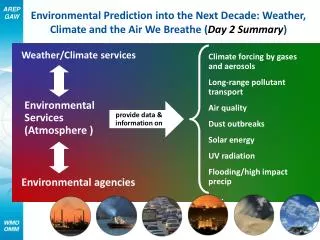
What is the Local Climate Analysis Tool (LCAT)? • Developed originally to support NWS field offices • Online interactive tool • For regional and local climate studies • State-of-the-art station • Best practices for climate analysis • Variables beyond average temp and precip NWS Field Office Need for LCAT • Easy access to standardized, scientifically sound methodologies for local climate analysis to meet growing needs of users • Manipulate and interpret local climate data • Make weather-climate linkages for better forecasts • Characterize climate impacts on water and weather elements
How does LCAT work? LCAT uses principles of Artificial Intelligence in connecting human and computer perceptions on application of data and scientific techniques in multiprocessing simultaneous users’ tasks How is the temperature in my town changing? Data: Homogenized station maximum temperature Analysis: best practices for trend; rate of change Output: statistics, plots, metadata LCAT LCAT USERS Should we expect floods during La Nina events? • Data: Homogenized precipitation and river flow • Analysis: composites, risk assessment • Output: statistics, plots, metadata How severe is the drought in my region this year? • Data: Drought indices • Analysis: time series analysis • Output: statistics, plots, metadata Which climate model performs best in my region? • Data: Reanalysis and GCM fields • Analysis: downscaling, sensitivity tests • Output: statistics, plots, metadata What are the projections for climate in my region? • Data: GCM outputs • Analysis: downscaling • Output: statistics, plots, metadata
LCAT Process USER Question Climate. gov publication New requirement to IWG, SAT Field Officer uses LCAT Capability not in LCAT Study saved in LCAT Local, Regional, SAT review of study Development Team Analysis submitted to LCAT 3-tier review Question answered Documentation/study Option
What is the Local Climate Analysis Tool (LCAT)? • The Integrated Working Team (IWT) identifies and communicates field requirements and assists in training development – NWS staff • The Science Advisory Teams (SATs) are composed of subject matter experts that recommend and approve scientifically sound methodologies – subject-matter experts • The LCAT Development Team (DT) organizes activities for the SATs and IWT, delivers training, and produces the tool – CSD, OST, and contractors The LCAT Process Integrated Working Team Drought Analysis and Impacts Climate Change Impacts Science Advisory Teams Climate Variability Impacts Water Resources Applications LCAT Development Team Attribution of Extreme Events
Five Science Advisory Teams • Science Advisory Teams are comprised of subject matter experts to research, review, and recommend ready-to-use methods, best practices, and tools for use in LCAT Drought Analysis and Impacts • Team members: NCDC, CPC and NDMC, WRCC • Identify best practices and tools for drought analysis • Types of tools: Drought portal drought atlas, drought impact reporter, etc Climate Change Impacts • Team members: NCDC and CPC • Identify best methods for trend fitting and analysis of climate change • Type of Analysis: OCN, EWMA, Hinge-fitting Climate Variability Impacts • Team members: CPC andESRL • Remain consistent and transparent with CPC methods for climate variability • Types of Analysis: Box and whisker plots Water Resources Applications • Team members: CBRFC, WWA RISA • Best practices for applications and climate studies for water resources • Types of Tools: Water Resource Outlook tools: stream-flow variability, ensembles, etc Attribution of Extreme Events • Team members: ESRL, CPC, and NCDC • Best practices and tools to identify and communicate climate signal in extreme meteorological and hydrological events • New science; tool will be developed as methods become available
LCAT allows users to define their analysis by selecting • Data (climate division or station) • Time period of interest • Climate variable • Method(s) of analysis • Output format Climate reports can be saved to contribute to attribution or other studies LCAT current location: https://apps.weather.gov/lcat/_dev/index.php?lcatArea=lcat
Enabled Studies Climate Change Impacts • Selection of Best PracticesCase study -- Local Rate of Climate Change • SAT (trend) considered available practices for time series analysis and recommended three trend-fitting techniques • Ensemble mean and variance provide additional information about the uncertainty inherent in the data and methods utilized in the analysis • Development is ongoing and will be in coordination with internal NOAA offices (CPC, ESRL, NCDC) and external partners (state climatologists, RCCs, etc) • Climate Study Reports are generated by LCAT, and include all graphs and tables of the data analysis, along with the variables selected by the user
Testing LCAT Best Practices Stations Climate Division (Inches per decade) http://www.cpc.noaa.gov/trndtext.shtml
Enabled Studies Climate Variability Impacts • Identifies is there is a relation between local climate element and climate variability event • Use an analysis of conditional probability or frequencies of occurrence of at least two events together, commonly called composites • Compositing is an alternative method to linear regression commonly used for comparison of two time series, but does not require any underlining distribution assumption of dependent and independent variables
Probability (P[x]) Probability (P[x]) Left Tail Right Tail Testing CV Impact Significance Test of composites statistical significance uses Hyper-Geometric Distribution for possible outcomes of climate variable category (B/A) observed within La Nina or El Nina sample Helps to identify if there is a relationship between ENSO events and the category (Alternative Hypothesis) The one-tail test conducted at 90% confidence level for both tails
Water Resources Applications LCAT will include links to relevant external climate analysis tools such as the National Water Resource Outlook webpage
Drought Analysis and Impacts LCAT will include links to relevant external climate analysis tools such as the Drought Atlas (coming soon)
Currently Under Development By September 2012 • Trend communication between Climate Change & Climate Variability sections • Additional output statistics displayed • Enhancements to help buttons and references • Personalized report labeling for easier reference • Reference maps for Climate Divisions, County Warning Areas, and station locations • Additional output formats available (comma-, space- or tab- delimited, XML, PDF and Excel) • Analog signal years displayed (e.g., years that were La Niña or El Niño) • Additional data sets: • Alaska and Hawaii stations • NCDC Climate Division Data • NOS Sea Level Stations LCAT FY13 plans • Tuning ONI index capability • Addition of Climate Variability Indices (NAO/AO, SOI, MEI ) • Functional link between xmACIS data and LCAT • Additional statistical analysis options (e.g., Multiple linear regression, logistic regression, PCA, etc.) • User defined variable seasons (e.g. 2- , 4-month or 6-month periods) • Increase of spatial options (e.g. county or state wide) • Additional options for definition of climate variable (e.g., critical value) • Multiple signal option combinations (e.g., Negative ONI with Positive AO) • Drought studies (incorporation of drought data) • Trouble Ticketing system implemented • Functionality improvements • Publication process available • Additional data sets: • Pacific Island Data sets • Reanalysis data • Unique data sets
LCAT Future • Incorporation of additional data sets (severe weather, snowfall, number of days with extremes, extreme time series, etc.) will enhance IDSS capabilities by providing integrated environmental services La Niña El Niño Neutral Yearly MAMJ
LCAT Future • To answer request to NWS from FEMA/WH • Capability to query database for historical information, trends and relationships to ENSO signals for high impact weather events for local, regional, and national geographical scales • Tornadoes, large hail, high winds (convective and non-convective), winter storms, blizzards, tropical storms and hurricanes, flooding, dust storms • For use prior to and during high impact events
LCAT Future • Water level (tides, etc.) and climate signals for coastal regions • What are water level extremes during El Niño or La Niña events? • Are there seasonal extremes? • Does the AO affect water levels on the NE coast? • Relative humidity, upper air, storminess, lightning, tornadoes, hurricanes, snow, radiation • What is the trend in snowfall in the Pacific NW? • What is the average speed of the midlatitude jet over Kansas during ENSO neutral years? • What is the probability of a greater than average number of hurricanes during a La Niña year? From NOAA/HRD
Gridded Data • Reanalysis data – CFSR • Grid point data • Averaging over a region • Model data at grid points and regions • CFSv2, FIM • 7 models of the NMME – individual model output and ensemble average • CMIP / IPCC models – AR5
LCAT Future • Data and analyses for energy industry support • What has been the maximum wind speed over the past 30 years? • What is the projection for the next 20-50 years? • What is the average daily cloud cover in a region during an El Niño winter? • What is the average radiation in the North East when the AO is in the negative phase? • Validation/evaluation of climate model output/performance by region • Analysis of regional trends in climate models • Spatial correlations to climate phenomena
Other Potential Parameters • CO2emissions/trends • Satellite data • Biological/physical ocean data • Ecological data for deriving relationships to climate signals (coastal, soil, demographics, vegetation) • NOAA Habitat Blueprint: A framework to improve habitat for fisheries, marine life, and coastal communities
Other Potential Applications • NOAA-CDC Partnership • No-cost means for sharing local climate data with health researchers and decision makers to aid in characterizing climate variability and change impacts on health in local communities • What is the climatology of a region as it pertains to proliferation of a vector to spread Dengue Fever? • If the past winter was warmer than average, what is the probability of a spring drought that will provide a ripe environment for the mosquito carrying the West Nile virus? • Provide temperature, humidity, and air quality analyses to CDC for deriving relationship between climate and incidence of COPD (Chronic Obstructive Pulmonary Disease) Dengue Fever Vector + high temperatures, humidity, and low wind speed
Other Potential Partnerships • DOE • NCDC • USGCRP • NOS • Space Weather Program • Marine Weather • Marine Habitats • Fire Weather Program • NWS Corporate Board • Tsunami • NOAA Climate Test Bed