Download
1 / 10
100 likes | 863 Vues
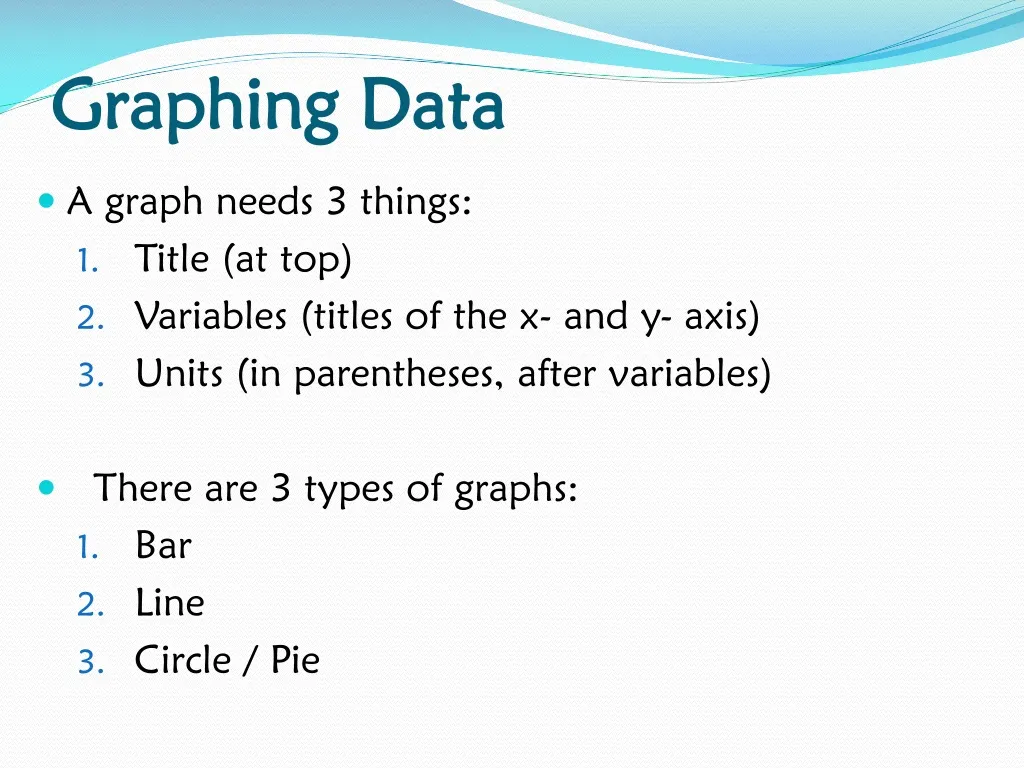
Graphing Data. A graph needs 3 things: Title (at top) Variables (titles of the x- and y- axis) Units (in parentheses, after variables) There are 3 types of graphs: Bar Line Circle / Pie. Graphing Data. BAR Graphs used to show COMPARISONS coordinates are (word, #)

E N D
Graphing Data • A graph needs 3 things: • Title (at top) • Variables (titles of the x- and y- axis) • Units (in parentheses, after variables) • There are 3 types of graphs: • Bar • Line • Circle / Pie
Graphing Data • BAR Graphs used to show COMPARISONS • coordinates are (word, #) • Ex. # of students in each grade with a 3.5 GPA • LINE Graphs used to show RATES • how one variable changes in response to another • coordinates are (#, #) also known as ordered pairs • TIME is always on the x-axis
Graphing Data • Pie Charts used to show portions of a whole • all segments add together to equal 100% • organized by size from smallest to largest in a clockwise direction
Graphing Data • Slope steepness of a graphed line • steeper = faster, lower = slower • can be positive (+) or negative (-) • ∆ y = rise ∆ x run • Independent (X-axis) Variable variable that is DELIBERATELY changed in an experiment • Dependent (Y-axis) Variable it CHANGES in response to the independent variable
Where Does the Information Come From? • A question is asked EXAMPLE What kind of ice cream does everyone like in our class?
How Is the Information Gathered? 2. A survey is made.
How Is the Information Presented? 3. A bar graph is made
Linear Relationships(Directly Proportional) Length V. Mass As the mass increases, the length of the spring increases • Variables of the line? • Units of the slope? • Slope of the line?
Inverse Relationship (y = k / x) Current V. Resistance As the resistance increases, the current decreases • Variables of the line? • Units of the slope? • Slope of the line?