Download
1 / 23
230 likes | 382 Vues
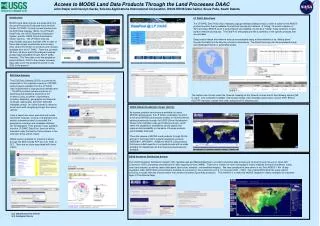
Integration of Earth Observing Systems and the U.S. Geological Survey. Integration of environmental monitoring networks:. Comprehensive, multi-dimensional study of environmental problems and their linkages Broader dissemination of monitoring technologies Greater operational efficiency.

E N D
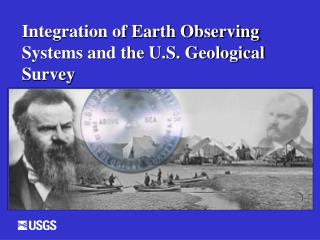
Integration of Earth Observing Systems and the U.S. Geological Survey
Integration of environmental monitoring networks: • Comprehensive, multi-dimensional study of environmental problems and their linkages • Broader dissemination of monitoring technologies • Greater operational efficiency
Elements of a “back-bone” network: • Consistent core variables • Standard sampling and calibration protocols • Integrated data management driven by internet distribution and GPS systems
Elements of a “back-bone” network: • EPA Estuarine Reserves • NOAA Estuarine Status and Trends network • NOAA ocean current and weather buoys • USGS Streamgaging stations
Streamgaging • Gage Network • 7,100 gages • 85 % real-time • Network Costs • $120M per year • About $12,500/gage Network Funding State / Local agencies 35% USGS Coop program 25% OFA 18% Mixed 15% USGS NSIP 7%
Traditional Methods Q=VA Discharge (Q)= Ave Velocity*Area Area=Depth*Width
USGS Stream Gage
Gages Monitor River Stage 1997 Flood New 100-year flood Old 100-year flood Peak Flow, CFS 1900 2000
WaterWatch • Real-time streamflow • Flood and High flow • Monthly Conditions (and historic) • Comparison of today and POR • Comparison of 7-Day Average and POR • Below normal • Drought Watch
Modernizing Flow Measurement Radars HydroAcoustics
HydroAcoustics • Doppler principle • Fast and accurate • Not effective in shallow water • Used with boats or tethered from bridges • Can be used as side-looking, velocity index meters
Side-Looking Doppler, Index-Velocity Discharge vs Traditional Discharge
Radars Q=V A • Microwave radar for surface velocity only • Ground-penetrating radar for channel area • GPR doesn’t work well in high conductivity or great depth