Download
1 / 55
560 likes | 706 Vues
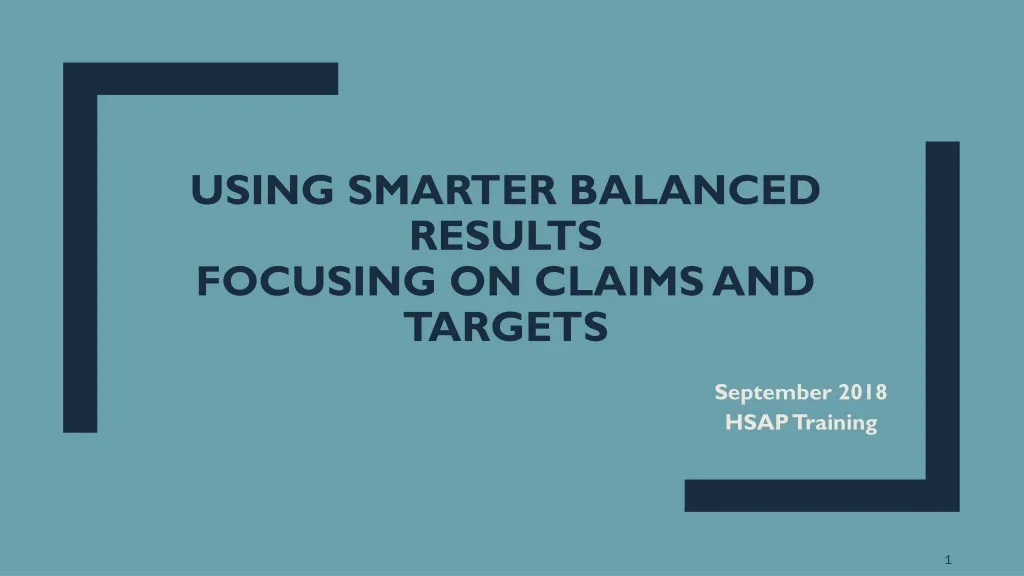
Using Smarter Balanced Results Focusing on Claims and Targets. September 2018 HSAP Training. Knowledge Check #1 Poll. How familiar are you with the ORS and Smarter Balanced Claims and Targets? Using your phone (or laptop if you have a hot spot), go to: www.menti.com enter code 760447.

E N D
Using Smarter Balanced Results Focusing on Claims and Targets September 2018 HSAP Training
Knowledge Check #1Poll • How familiar are you with the ORS and Smarter Balanced Claims and Targets? • Using your phone (or laptop if you have a hot spot), go to: • www.menti.com • enter code 760447 2 minutes End
Smarter A Balanced Assessment System Summative Assessments: College and career readiness assessments for accountability Teachers and schools have information and tools they need to improve teaching and learning All students leave high school college and career ready Common Core State Standards InterimAssessments: Flexible, open, used for actionable feedback Digital Library: Teacher resources for formative tools - practices to improve instruction
Hawaiʻi Smarter Balanced Summative ResultsSample Graph – Hawaii State Performance – Grade 8 Mathematics Range of student performance Widest part = level where MOST students performed 90th percentile 50th percentile mean 10th percentile
Investigating Claim and Target Data: An Overview • What are claims and targets? • Where can I learn about how my school performed on claims and targets? • How do I understand claim and target data? • What are my next steps?
Investigating Claim and Target Data What are claims and targets? Where can I learn about how my school performed on claims and targets? How do I understand claim and target data? What are my next steps?
Relationship between Smarter Balanced Claims/Targets and the Common Core Standards Example: Grade 3 ELA/L Relationship Overall Claim Students can demonstrate progress toward college and career readiness in English language arts and literacy. Claim 1 (Reading) Students can read closely and analytically to comprehend a range of increasingly complex literary and informational texts. Target 1 (Key Details) Given an inference or conclusion, use explicit details and implicit information from the text to support the inference or conclusion provided. CCSS 3.RL.1 (Reading Literature Standard 1) Ask and answer questions to demonstrate understanding of a text, referring explicitly to the text as the basis for the answers.
How Will Claim and Target Information Help My School? Claim Report Target Report • Provides school administrators with an understanding of learning trends in their schools • Provides teachers with an understanding of their students’ progress and achievement, and allows them to identify areas of strengths and areas needing support • Can be used as a guide for professional development for content area teachers • Provides information about how students (down to the roster level) performed on specific skills in each content area • Provides a snapshot of how students are progressing towards grade-level expectations in each content area
Knowledge Check #1Results Let’s look at our poll results!
Investigating Claim and Target Data What are claims and targets? Where can I learn about how my school performed on claims and targets? How do I understand claim and target data? What are my next steps?
Online Reporting System (ORS) • Digital format of the Family Report, the Individual Student Report (ISR) • Aggregate claim- and target-level reports • Summary statistics • Export student results • Roster management
ORS Welcome Page • To view the SBA data: • Select the desired location (complex area, complex, school, etc.) that you are interested in viewing depending on your role • Click on “Score Reports”
ORS Home Page Dashboard Select “Smarter Summative” and the administration date (2017-2018) Click on the third radio button Click on a grade and subject to view complex area data
Investigating Claim and Target Data What are claims and targets? Where can I learn about how my school performed on claims and targets? How do I understand claim and target data? What are my next steps?
Claim Performance at the Student Level White bar – claim achievement standard Black bar – student’s performance relative to the claim achievement standard Green bar – the score range that the student would likely fall within if he/she took the test multiple times (Standard error of measurement) • The icons next to each bar chart shows how the student performed for that claim: • Above the standard • At/near the standard • Below the standard
Assessment Targets • Map the standards in the CCSS onto assessment evidence that is required to support the claims. They are the clusters of the CCSS. • Assessment targets are used to guide the development of items and tasks that will measure the CCSS. • ELA target reports are available for all claims. • Math target reports are only available for Claim 1
Targets Report - Mathematics Performance Relative to Proficiency: Provides information about a group’s target performance in relation to proficiency levels. This column displays whether the target performance is above, at, or below the Smarter Balanced proficiency levels. Performance Relative to the Test as Whole: Shows how a group of students performed in each target relative to their performance on the entire test. Unlike achievement levels (1-4) provided for the entire test, the strengths and weaknesses at each target on this report are relative to the test as a whole.
Smarter Balanced Blueprint: Mathematics Targets Claim 1
Smarter Balanced Blueprint: ELA/L Targets Claim 1
Look at the ‘Handout’ with: Target Report for a Grade 5 Math Class Grade 5 SB Math Summative Blueprint for Claim 1 Knowledge Check #2 • Questions: • Which column provides information on how the group of students performed relative to the overall level 3 cut score? • Which column helps narrow the scope on where you should focus instruction? • 3. Which targets on the target report are considered ‘priority clusters’? • 4. How many questions are aligned to Target F? • Describe how this group of students performed on Target F. Analyzing Results 5 minutes End
Which column provides information on how the group of students performed relative to the overall level 3 cut score? Performance Relative to Proficiency • Which column helps narrow the scope on where you should focus instruction? Performance Relative to the Test as a Whole • Which targets on the target report • are considered ‘priority clusters’? See circled targets • How many questions are aligned to Target F? 5 • Describe how this group of students performed on Target F. Overall, they are meeting grade level expectations on the content measured by this target. This group performed above proficiency for this target but performed about as well on items from this target as they did on the rest of the test.
1. Generate a Claims Report (School) Ms. Karen Ms. Kelsie Ms. Dianne
4. Prioritize Targets to Focus On Target C Target E Target D
5. Identify the standards that align to the identified targets • Locate resources that align Assessments to the CCSS to find standards that align to the identified targets
6. Identify sample questions that map to these targets/standards http://www.smarterbalanced.org/assessments/development/
Math Item Specifications Grade 5, Claim 1, Target C
Sample question stems clarify what that evidence could look like. The Item Specifications show what evidence to collect from students in order to evaluate student understanding.
Connecting Assessment Data and Resources • Generate a Claims Report (Claim Reports on the ORS) • Which claims did students perform and/or did not perform as well on? • Generate a Target Report (Target Reports on the ORS) • How did the selected group of students perform relative to proficiency? • How did the selected group of students perform on the test as a whole? • Which targets did this group of students perform above/near/below relative to the proficiency standard? • Which targets did this group of students perform better/similar/worse on relative to the test as a whole? • Which targets did this group of students perform both above/near/below relative to the proficiency standard and better/similar/worse on relative to the test as whole? • Determine Targets to Focus on (SB Summative Blueprints on alohahsap.org) • Which targets are priority clusters? • Prioritize Targets to Focus On (SB Summative Blueprints and Target Reports) • Which of the targets that are focus areas are also priority clusters? • Identify the Standards that Align to the Identified Targets (Riverside Crosswalk Documents) • Which standards align to the targets that are focus areas? • Identify Sample Questions that map to the Identified Targets/Standards (SBA Item Specifications) • What do these questions aligned to these focus areas look like?
Investigating Claim and Target Data What are claims and targets? Where can I learn about how my school performed on claims and targets? How do I understand claim and target data? What are my next steps?
Table Talk How does your school use the Smarter Balanced Summative results? (e.g., types of analyses, interventions, etc.) 5 minutes End
Potential Next Steps • Identify a Team • Gather Evidence – What evidence will your school rely upon to determine learning progress? How often will they collect this evidence? • Analyze and Identify • Areas of Need – What areas of learning require more support? • Areas of Strength – How can these successful strategies be shared around the school? • Strategize and Plan Using Evidence • What works for your school may not work for all schools • Standards • Instructional Research • Utilize Assessment-Related Resources • Interim Assessment Comprehensive Assessments • Interim Assessment Blocks • Digital Library and Instructional Supports • Item Writing Project and Assessment Literacy • Monitoring and Check-ins • Build in time for check-ins • Follow up on progress • Repeat cycle as necessary – It is very likely that this will not be a static process.
A Balanced Assessment System English Language Arts/Literacy and Mathematics, Grades 3-8 and 11 School Year Last 12 weeks of the year DIGITAL CLEARINGHOUSE OF FORMATIVE TOOLS, PROCESSES AND EXEMPLARS Released items and tasks; Model curriculum units; Educator training; Professional development tools and resources; Scorer training modules; Teacher collaboration tools; Evaluation of publishers’ assessments. Interim Assessments (ICA/IAB) Interim Assessments (ICA/IAB) • COMPUTER ADAPTIVE TESTS • ELA/Literacy • Mathematics • PERFORMANCE TASK • ELA/Literacy Computer Adaptive Assessments and Performance Tasks Computer Adaptive Assessments and Performance Tasks Scope, sequence, number and timing of interim assessments locally determined
Connecting Smarter Balanced Results and Instruction Administer ICAs and/or IABs throughout the year. Retrieve and analyze student results in ORS and AIR Ways reporting. Educators collaborate witheach other and plan next steps for instruction and find resources in Digital Library.
Interim Assessments • Interim Comprehensive Assessments (ICA) • Measure same content and standards as the Summative Assessments • Can be administered multiple times during the year and at grade levels that are not tested (including grades 9 and 10) • Can be used as a Practice Test • Interim Assessment Blocks (IAB) • Focus on specific topics • Each block has between 4 and 18 items depending on grade and content area • Provide information about student performance in three categories: Above Standard, Near Standard, and Below Standard • Between 5 and 12 blocks per content area per grade
Interim Comprehensive Assessment (ICA) Scores • The ICAs are reported using the same three types of scores as the Summative: • Overall scale score • Achievement level • Claim achievement category • The scores are determined the same way as the Summative Scores.
Interim Assessment Block (IAB) Scores • The IABs are reported using a “performance category”: • Above • At/Near • Below • This is very similar to the “claim achievement category” on the Summative. • The IAB performance categories are determined the same way as the summative claim score categories.