Download
1 / 43
450 likes | 464 Vues
Developmental Models/ Longitudinal Data Analysis. Danielle Dick & Nathan Gillespie Boulder, March 2006. Why conduct longitudinal analyses?. Can improve power by using multiple observations from the same individual Can examine time-dependent genetic and environmental effects

E N D
Developmental Models/Longitudinal Data Analysis Danielle Dick & Nathan Gillespie Boulder, March 2006
Why conduct longitudinal analyses? • Can improve power by using multiple observations from the same individual • Can examine time-dependent genetic and environmental effects • Changing magnitude of genetic/environmental influence across development • Same versus different genes across development
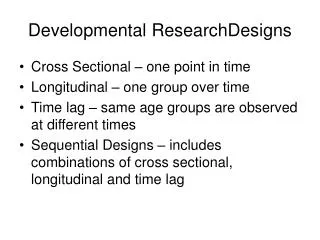
Methods for Longitudinal Analysis • Cholesky Models • Simplex Models • Growth Curve Models
Cholesky Model • Advantages: • Logical: organized such that all factors are constrained to impact later, but not earlier timepoints • Requires few assumptions, can predict any pattern of change • Disadvantages: • Not falsifiable • Does not make predictions about what will happen in the future (as yet unmeasured timepoints) • Only feasible for limited number of measurements
Cholesky Model • Questions you can address: • Magnitude of genetic/environmental influence at each time • Extent to which genetic/environmental influences overlap across time
Trivariate Cholesky Decomposition A2 A1 A3 Age 16 Substance Use Age 17 Substance Use Age 18 Substance Use C3 E2 E3 E1 C1 C2
Partitioning of Variance from Longitudinal Drinking Data X2 = 57.462, df = 45, p = .101, AIC = -32.538, RMSEA = .011 Rose, Dick 2001, ACER
Cholesky Model • Questions you can address: • Magnitude of genetic/environmental influence at each time • Extent to which genetic/environmental influences overlap across time • Other standard multivariate extensions (e.g., multiple group models)
Methods for Longitudinal Analysis • Cholesky Models • Simplex Models • Growth Curve Models
What aresimplex/autoregressive models? • Models with a specific structure of association whereby correlations are largest between adjoining measures, and drop off systematically as distance between variables increases • This structure is frequently observed with longitudinal data: • Classic example: weight measurements • 2 year intervals from age 5 to 15 • you would expect that weight at age 5 would be most highly correlated with weight at 7, somewhat less correlated with weight at 9, less correlated with weight at 11, etc.
Simplex Model (Boomsma & Molenaar, 1987)
Genetic Simplex Model x11 x22 x33 x44 n21 n32 n43 A A A A 1 1 1 1 BAC2 BAC3 BAC4 BAC6 u22 u33 u44 u11 1 1 1 1 p21 p32 p43 E E E E z11 z22 z33 z44 x and z = genetic and nonshared environmental innovations respectively n and p = genetic and nonshared environmental transmission respectively u = error variances
Simplex Model • Advantages: • Makes restrictive predictions about covariance pattern • Falsifiable
Today’s example • Grant et al., 1999, Behavior Genetics, 29, 463-472. • Australian alcohol challenge data, collected between 1979 and 1981 • Mean age = 23.5 years • Subjects drank 0.75 g/kg alcohol at a steady rate over a 20-minute period. Blood Alcohol Concentration (BAC) was assessed at 6 points after consumption:
A simplex correlation pattern… • Sample correlations (the DZM twin A quadrant of an intraclass correlation matrix)
Practical - Simplex Model x11 x22 x33 x44 n21 n32 n43 A A A A 1 1 1 1 BAC2 BAC3 BAC4 BAC6 u22 u33 u44 u11 1 1 1 1 p21 p32 p43 E E E E z11 z22 z33 z44 x and z = genetic and nonshared environmental innovations respectively n and p = genetic and nonshared environmental transmission respectively u = error variances
Practical - Simplex Model x11 x22 x33 x44 n21 n32 n43 A A A A 1 0 0 0 0 2 0 0 0 0 3 0 0 0 0 4 1 1 1 1 BAC2 BAC3 BAC4 BAC6 u22 u33 u44 u11 1 1 1 1 p21 p32 p43 E E E E z11 z22 z33 z44 x and z = genetic and nonshared environmental innovations respectively n and p = genetic and nonshared environmental transmission respectively u = error variances
Practical - Simplex Model ? ? ? ? A A A A 1 1 1 1 BAC2 BAC3 BAC4 BAC6 ? ? ? ? 1 1 1 1 E E E E ? ? ? ? x and z = genetic and nonshared environmental innovations respectively n and p = genetic and nonshared environmental transmission respectively u = error variances
Full Genetic Simplex Model 12.0279 6.5234 .7036 4.2649 0.9892 0.5332 1.3123 A A A A 1 1 1 1 BAC2 BAC3 BAC4 BAC6 -0.1840 -0.1840 -0.1840 -0.1840 1 1 1 1 0.7001 0.5027 0.4130 E E E E 9.4624 5.0094 10.3650 5.1284 Basic_simplex.mxo -2*LL=4620.028, 23 est. parameters, 606 df
Sub-Models • Is the error variance on individual variable assessments significant? • Is the genetic innovations on BAC6 significant? BAC4? BAC2?
Sub-Models • Is the error variance on individual variable assessments significant? - drop 200 • Is the genetic innovations on BAC6 significant? BAC4? BAC2? - drop 4, 3, 2
Simplex Model • Advantages: • Makes restrictive predictions about covariance pattern • Falsifiable • Disadvantages: • Makes restrictive predictions about covariance pattern (future depends on current state only) • Number of parameters increases with number of measurements
Methods for Longitudinal Analysis • Cholesky Models • Simplex Models • Growth Curve Models
Latent Growth Curve Model (shown here as linear) • Mean Level of the Trait (Intercept) • Rate of Change In Trait (Slope)
Latent Growth Curve Model (shown here as linear)
Genetically Informative Latent Growth Curve Model
Genetically Informative Latent Growth Curve Model →Like a bivariatemodel!
Growth Model Questions • What is the contribution of genetic/environmental factors to the variation of α (intercept) and (slope)? • Same or different genes influencing α (intercept) and (slope)? • Same or different environments influencing α (intercept) and (slope)?
Practical • Mx latent growth curve example (script from http://www.psy.vu.nl/mxbib/) Submodels to test: • No covariance between slope and intercept • No genetic effect on intercept • No genetic effect on slope • No common environmental effect on intercept • No common environmental effect on slope • Best fitting model? (i.e., ACE, AE, CE, E?)
1.0 (0.5) 1.0 A C E A C E x22 x21 x11 Intercept Slope 1.0 1.0 F41 0 3 F11 1.0 1.0 1 2 F31 F21 Time 1 Time 2 Time 3 Time 4 L11 L11 L11 L11 L L L L
Practical • Mx latent growth curve example (script from http://www.psy.vu.nl/mxbib/) Submodels to test: • No covariance between slope and intercept – signif decrease in fit • No genetic effect on intercept – signif decrease in fit • No genetic effect on slope – signif decrease in fit • No common environmental effect on intercept -- ns • No common environmental effect on slope -- ns • Best fitting model? (i.e., ACE, AE, CE, E?) -- AE
Growth Curve Model • Advantages: • Very efficient: number of parameters does not increase with number of measurements • Provides prediction about behavior beyond measured timepoints • Disadvantages: • Note regarding slope parameters • Can be computationally intense • Assumptions to reduce computational burden • Linearity, no genetic effects on residuals, equal variance among residuals at differing timepoints
Latent Growth Curve ModelingAdditional Considerations • Standard approach assumes data are collected at identical set of fixed ages for all individuals (e.g., start at age 12, yearly assessments) • Age heterogeneity and unequal spacing of measurements can be handled using definition variables • Mehta & West, 2000, Psychological Methods
1.00 0.00 1.00 1.00 1.00 1.00 1.00 1.00 1.00 1.00 1.00 cs2 1.00 -1.00 -0.05 ei es ci -0.10 -0.10 ci 0.18 As 0.18 Ci1 0.08 Cs1 ai 1.00 Cs2 1.00 Ci2 cs2 Es1 Ai1 Es2 1.00 Ei1 0.30 As1 es2 Ai2 as2 As2 Ei2 -0.05 1.00 0.00 As -0.15 0.18 es 1.00 0.08 -0.10 -1.00 ei as2 -0.10 1.00 0.18 S1 I1 S2 I2 1.00 ai 0.30 es2 M -0.15 1.00 1.00 1.00 1.00 1.00 lgdri172 lgdri182 lgdri171 lgdri181 lgdri162 1.00 1.00 T1 T1 T3 T3 T2 T2 Er Er 1.00 1.00 Ar Ar 1.00 1.00 Er Er Ar Cr Cr Ar Cr Cr 1.00 Cr Cr Er 1.00 Ar Er Ar 1.00 1.00 1.00 1.00 1.00 1.00 1.00 1.00 1.00 Latent Growth Curve Model with Measured Variable Age lgdri161 1.00
Extensions of Growth Curve Models • Incorporation of measured variables (genotype, environment) • Nonlinear growth • Neale, MC & McArdle, JJ (2000). A structured latent growth curves for twin data. Twin Research, 3, 165-177. Intercept Slope 1.0 1.0 0 4 1.0 1.0 1 2 Time 1 Time 2 Time 3 Time 4 L L L L
Latent Growth Curve Modeling • McArdle, JJ (1986). Latent variable growth within behavior genetic models. Behavior Genetics, 16, 163-200. • Baker, LA et al. (1992). Biometrical analysis of individual growth curves. Behavior Genetics, 22, 253-264. • McArdle, JJ et al. (1998). A contemporary method for developmental -genetic analyses of age changes in intellectual abilities. Developmental Neuropsychology, 14, 69-114.
Summary of Longitudinal Models • Cholesky Model • Few assumptions, predict any pattern of correlations • Not falsifiable • Limited measurements • Simplex Model • Falsifiable • Limited measurements • Growth Curve Model • G, E influences on initial level, rate of change • Unlimited measurements • Computationally intensive, assumptions