Download
1 / 6
60 likes | 115 Vues
The Women’s Business Council: The Life Cycle - Evidence Paper.

E N D
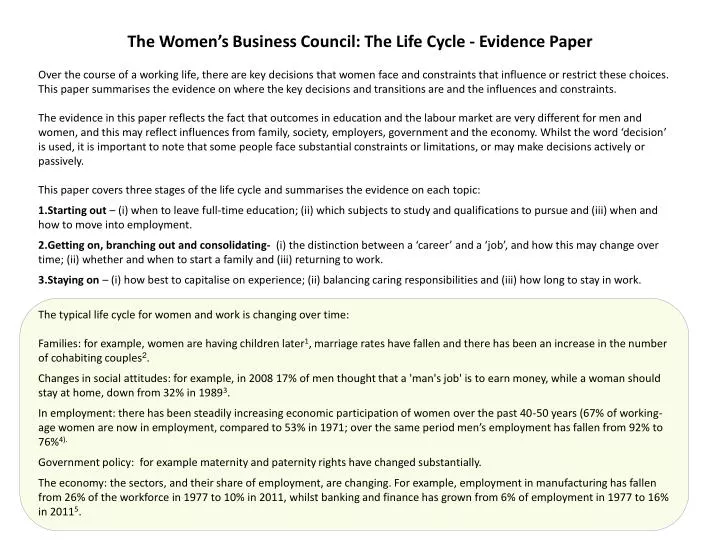
The Women’s Business Council: The Life Cycle - Evidence Paper • Over the course of a working life, there are key decisions that women face and constraints that influence or restrict these choices. This paper summarises the evidence on where the key decisions and transitions are and the influences and constraints. • The evidence in this paper reflects the fact that outcomes in education and the labour market are very different for men and women, and this may reflect influences from family, society, employers, government and the economy. Whilst the word ‘decision’ is used, it is important to note that some people face substantial constraints or limitations, or may make decisions actively or passively. • This paper covers three stages of the life cycle and summarises the evidence on each topic: • Starting out – (i) when to leave full-time education; (ii) which subjects to study and qualifications to pursue and (iii) when and how to move into employment. • Getting on, branching out and consolidating- (i) the distinction between a ‘career’ and a ‘job’, and how this may change over time; (ii) whether and when to start a family and (iii) returning to work. • Staying on – (i) how best to capitalise on experience; (ii) balancing caring responsibilities and (iii) how long to stay in work. • The typical life cycle for women and work is changing over time: • Families: for example, women are having children later1, marriage rates have fallen and there has been an increase in the number of cohabiting couples2. • Changes in social attitudes: for example, in 2008 17% of men thought that a 'man's job' is to earn money, while a woman should stay at home, down from 32% in 19893. • In employment: there has been steadily increasing economic participation of women over the past 40-50 years (67% of working-age women are now in employment, compared to 53% in 1971; over the same period men’s employment has fallen from 92% to 76%4). • Government policy: for example maternity and paternity rights have changed substantially. • The economy: the sectors, and their share of employment, are changing. For example, employment in manufacturing has fallen from 26% of the workforce in 1977 to 10% in 2011, whilst banking and finance has grown from 6% of employment in 1977 to 16% in 20115.
Figure 1: The Life Cycle Staying on How best to capitalise on experience Balancing caring responsibilities How long to stay in work Starting out When to leave full-time education Which subjects to study and qualifications to pursue When and how to move into employment PARENTAL INFLUENCE Retirement Starting out Staying on Getting on, branching out and consolidating The distinction between a ‘career’ and a ‘job’ Whether and when to start a family Returning to work. Engaging, getting on and branching out
Starting out When and how to move into employment In the first job young people take, educational attainment has a stronger correlation with wages for women than it does for men14. This is partly explained by the fact that women with few qualifications earn, on average, much less than men with few qualifications, whilst the gap for graduates is smaller15. Figure 2 shows the average earnings of those with a degree, compared to the proportion of women who hold a degree in each subject area. There is a strong negative correlation – the subjects that women tend to study lead to lower earnings in the labour market. The general conditions in the economy are important for job outcomes. Research using longitudinal cohort studies found that young people who were entering the labour market around the 1980-82 recession had lower starting wages and were more likely to experience instability in their working lives than those born earlier or later17. The tough economic conditions now are having a similar effect – youth unemployment, at just under a million, is much higher than pre-recession18. The recession also led to more graduates going into low-skilled jobs19. The effect of economic cycles is not gender-neutral, and the industries that are growing and contracting will have an impact on employment prospects for men and women. The number of women doing apprenticeships has risenfrom 138,000 in 2009/10 to 330,000 in 2010/11 – and women now make up 50% of those on apprenticeships20. This increase is mostly due to the expansion of apprenticeships into sectors with a large female workforce (e.g. retail and business administration); there has been no significant increase in the proportion of women in traditionally male-dominated (and better paid) sectors such as engineering21. Success in education and choices taken at a young age can shape the options that will be open when moving onto work. Whilst girls tend to perform better academically than boys, and more women than men now attend university, women are less likely to choose the subjects that lead to the highest earnings. When to leave full-time education, which subjects to study and qualifications to pursue Parents are a key influence. The aspirations of parents are closely correlated with children’s aspirations6 and parental involvement in education can lead to improved education outcomes7. Those with parents who hold vocational qualifications are more likely leave full-time education earlier8. A survey by Ofsted found that primary school children held conventionally stereotyped views about men’s and women’s jobs9. Girls at secondary school were much more open to the idea of pursuing a career that challenged stereotypes, but very few did in practice. A recent survey found that 56% of girls aged 11-21 thought that there was not enough advice about choosing the right GCSEs and A-Levels10. Work experience placements are often based on traditional gender roles; the most common work experience placements for girls at secondary school are in schools (26%), playgroups or nurseries (11%) and in retail (10%)10. Girls now out-perform boys at almost all levels in education. In 2009/10, 57% of girls achieved 5 or more GCSE’s grades A*-C including English and Maths, compared to 49% of boys. At A-Level, 78% of women achieve grades A-C in the A-Levels they take, compared to 73% of men11. There has been a marked increase in the number of women attending university: 35 years ago, only 2 in every 100 women aged 25 to 30 had a degree, whilst now 24 in every 100 have a degree12. Over half (57%) of those completing an undergraduate degree in 2011/12 were women13. Figure 2: Earnings of graduates (of all ages) by subject area16
Getting on, branching out and consolidating Whether and when to start a family and returning to work The average age at which mothers have their first child has been increasing, from 26.0 twenty years ago to 28.0 in 201125. The number of women who are not working because they are looking after family has fallen since the 1990’s and has fallen since the recession. There are now 2.08 million women who are economically inactive (not in work and not looking for work) and looking after family, see Figure 326. The average length of maternity leave taken increased significantly between 2006 and 2008 (from 32 to 39 weeks), reflecting changes in legislation brought in in 2007. Mothers who work for small firms take less maternity leave than those who work for larger employers. 91% of fathers took time off after the birth but only 29% of fathers took more than two weeks27. Attitudes and policies of employers can make a huge difference to maternity choices. An investigation by the Equal Opportunities Commission in 2005 estimated that each year almost half of the 440,000 pregnant women in Great Britain face some disadvantage at work and as many as 30,000 may be forced out of their job28. There are significant differences in attitudes between small and large employers. A survey of employers in 2005 found negative attitudes towards pregnancy in many small employers29. 36% of small employers and 22% of large employers agreed that “pregnancy places and undue cost burden on this organisation”. One survey also found that 64% of employers do not expect mothers to return to work and that 16% said that they did not want staff on maternity leave to return citing reasons such as a “reduced level of concentration” and that they will “lack enthusiasm” compared to new staff30. A key influence when returning will be the availability and cost of informal and formal childcare. 35% of parents with a child aged 0-2 and 86% with a child aged 3-4 use formal childcare31. Costs of childcare have been rising faster than average wages in recent years and a quarter of non-working mothers report that they would not earn enough to make working worthwhile32. The jobs that women enter into at a young age will have implications for the options available later in the career. Once in work, women may stay in the same occupation, may cycle in and out of jobs, or make take a decision to move to a different occupation. The distinction between a ‘Job’ and a ‘career’ Some people will set out on a career, but some will simply want a job. Individuals may move between these two states over time. There is substantial ‘churning’ in and out of jobs for low paid workers and this is especially true for women. One study found that, over a five-year period, 90% of employed men were continuously employed but only 68% of employed women were. Women in professional or managerial jobs were much more likely to be continuously employed22. Progression out of low paid work into well-paid jobs is the exception rather than the norm23. Of those who are in employment and looking for another job, just over half (53%) make a major change in their occupation. This proportion is similar for men and women. Those who move to a new occupation from a state of employment are likely to show upwards or sideways mobility (i.e. move to a higher or similarly paid occupation). However, those who change occupation after a spell of unemployment tend to show higher levels of occupational downshifting24. Setting up a business is discussed in the final stage – “Staying on”. Figure 3: Number of women economically inactive who are looking after family34 Motherhood and earnings The effect of motherhood on future earnings is found to be a long-term effect, primarily because of the lost years of labour market experience (which is a key determinant of earnings). The type of job also matters: switching to more family-friendly jobs and part-time work also has significant impacts on earnings33.
Staying on Capitalising on experience: differences between younger and older women Capitalising on experience will mean different things to those with different characteristics. It is worth noting that older women now are different from the younger generation.Better educational attainment (see Figure 4) and higher expectationsmean the younger generation are better placed to take advantage of growth sectors in the economy36. Also, improved health and disability free life expectanciesmean they are less likely to need support or time off for health problems37. However, the younger generation are still likely to take time out of the labour market to have children (and may also face greater pressures related to caring due to delayed maternity, longer life expectancy – meaning greater care needs for elderly relatives). There has been a significant increase in the number of people living alone aged 45-64, up from 1.8 million in 2001 to 2.4 million in 2012 (47% were women)38. This is partly explained by patterns in divorce rates – whilst there has been a fall in the total number of divorces in the UK, there has been an increase for those aged 45-59 (from 55,000 in 2001 to 60,000 in 2011)39. Older women tend to be located in sectors of the economy where fewer jobs are forecast to be created in the future - public administration, education, health and social work – the majority of jobs growth is forecast to be in financial or professional services, or information and communication services40. Increasingly, women will need to consider how best to make use of the experiences they have built up. Here we summarise entrepreneurship (which is an option in all life stages), balancing caring responsibilities and whether and how long to stay in work Capitalising on experience: starting a business and entrepreneurship Roundtables held by GEO with small business owners suggest that there are several stages in the life cycle at which women may start their own business: (i) directly from education (but only with strong parental steers and support); (ii) After having children; (iii) as a response to redundancy from large employers (primarily women in their 30’s and 40’s); or (iv) as a ‘fresh start’ in later life following a lump sum of capital or a divorce settlement (primarily women in their 40’s and 50’s). There has been a significant increase in the number of women self-employed since the recession (although it is important to note here that self-employment is not the same as running a business). Survey data suggests that up to 19% of self-employed women went into self employment for a ‘fresh start’ or a change; 16% because of family commitments or a will to work at home and 15% because an opportunity arose or they saw a market. Men are much more likely than women to move into self-employment as a response to redundancy35. Balancing caring responsibilities and how long to stay in work Many older women have caring responsibilities for elderly and/or disabled family – and women are much more likely to be full-time carers. One in five women aged 45-59 is a carer. Many carers who are also in paid work are at risk of falling out of work because of poor services and a lack of support at work (a quarter of working carers report that they feel they receive inadequate support to enable them to combine work and care) and about a quarter of carers who do not work report that they would like more paid work but think there is inadequate services or flexible working or do not want to lose entitlement to benefits41. Men and women are retiring later. The average age of withdrawal from the labour market has increased from 61.2 years in 2004 to 62.3 years in 2010 for women and has increased from 63.8 to 64.6 for men42, and this is likely to continue43. Expectations are also shifting for those in work, but this varies by gender: nearly twice as many women (66%) than men (34%) expect to retire past state retirement age44. Figure 4: Highest qualifications of women by age, UK, 201045
Contact: Women’s Business Council: wbc@homeoffice.gsi.gov.uk References: Longhi & Taylor (2011) ‘Occupational Change and Mobility Among Employed and Unemployed Job Seekers’ Institute for Economic and Social Research Working Paper 2011-25 ONS (2012) ‘Births and Deaths in England and Wales 2011’ Office for National Statistics Labour Market Statistics May 2012, Office for National Statistics Chanfrau, Gowland, Lancaster, Poole, Tipping & Toomse (2011) ‘Maternity and Paternity Rights and Women Returners Survey 2009/10’ Department for Work and Pensions Research Report 777 Equal Opportunities Commission (2005) ‘Greater Expectations’ Young & Morrell (2005) ‘Pregnancy Discrimination at Work: a survey of employers’ Equal Opportunities Commission Working Paper Series No.20 Survey of 1,926 employers by Reabur Ltd. Reported in HR Magazine: http://www.hrmagazine.co.uk/hro/news/1019966/employers-dont-expect-mothers-return-maternity-leave Smith, Poole, Perry, Wollny & Reeves (2010) ‘Childcare and Early Years Survey of Parents 2009’ Department for Education Research Report No. 54 Smith, Poole, Perry, Wollny & Reeves (2010) ‘Childcare and Early Years Survey of Parents 2009’ Department for Education Research Report No. 54; Daycare Trust ‘Childcare Costs Survey 2012’ http://www.daycaretrust.org.uk/pages/childcare-costs-surveys.html Bastagli & Stewart (2011) ‘Pathways and Penalties: Mothers’ employment trajectories and wage growth in the Families and Children Study’ Centre for Analysis of Social Exclusion, London School of Economics Labour Market Statistics May 2012, Office for National Statistics Labour Market Statistics May 2012, Office for National Statistics Dawson, Henley & Latreille (2009) ‘Why Do Individuals Choose Self-Employment?’ IZA Discussion Paper No. 3974 ONS (2011) ‘Older People’s Day: Statistical Bulletin’ Office for National Statistics http://www.ons.gov.uk/ons/dcp171778_235000.pdf ONS (2013) ‘Families and Households 2012’ Office for National Statistics ONS (2012) ‘Divorces in England and Wales 2011’ Office for National Statistics UKCES (2012) ‘Working Futures 2010-2020’ UK Commission for Employment and Skills Evidence Report 41; Analysis by the Government Equalities Office using the Annual Population Survey 2010 Figures provided by Carers UK, quoted in: Hills (Chair) (2010) ‘An Anatomy of Economic Inequality in the UK: Report of the National Equality Panel’ Government Equalities Office; Centre for Analysis of Social Exclusion Report 60 Office for National Statistics, Pension Trends 2012, http://www.ons.gov.uk/ons/rel/mro/news-release/average-age-of-retirement-rises-as-people-work-longer/pension-trends.html UKCES (2012) ‘Working Futures 2010-2020’ UK Commission for Employment and Skills Evidence Report 41 LV= (2011) ‘Working Late Index 2011’ http://www.lv.com/adviser/working-with-lv/news_detail/?articleid=2776173 Internal analysis by the Government Equalities Office using the Labour Force Survey 2010 • ONS (2011) ‘Births and Deaths in England and Wales 2010’ Office for National Statistics • ONS (2012) ‘Families and Households 2001 to 2011’ Office for National Statistics • NatCen (2008) ‘British Social Attitudes 24th Report’ http://www.natcen.ac.uk/media-centre/press-releases/2008-press-releases/british-social-attitudes-24th-report • Labour Market Statistics May 2013, Office for National Statistics • IFS (2012) ‘Jubilees Compared’, http://www.ifs.org.uk/publications/6190 • St Clair, Kintrea and Houston (2011) ‘The influence of parents, places and poverty on educational attitudes and aspirations’ Joseph Rowntree Foundation • DCSF (2008) ‘The Impact of Parental Involvement on Children’s Education’ Department for Children, Schools and Families • Crawford, Duckworth, Vignoles & Wyness (2011) ‘Young People’s Education and Labour Market Choices Aged 16/17 to 18/19’ Department for Education Research Brief 182 • Ofsted (2011) ‘Girls’ Career Aspirations’ Ofsted • Girlguiding UK (2011) ‘Girls’ Attitudes Survey 2011’ http://girlsattitudes.girlguiding.org.uk/data_and_report.aspx • Department for Education (2012) https://www.education.gov.uk/researchandstatistics • IFS (2012) ‘Jubilees Compared’ Institute for Fiscal Studies • Higher Education Statistics Authority 2011/12 • Bukodi (2009) ‘Education, First Occupation and Later Occupational Attainment: Cross-cohort changes among men and women in Britain’ Centre for Longitudinal Studies Working Paper 2009/4 • Prospectus ‘Graduate and Non-Graduate Earnings from the Labour Force Survey (Figures from 2001-2002) http://ww2.prospects.ac.uk/cms/ShowPage/Home_page/Members___Log_in/Labour_market_information/Graduate_Market_Trends/Graduate_and_non_graduate_earnings_from_the_Labour_Force_Survey__Spring_03_/p!emjibX • Analysis by the Government Equalities Office using the Labour Force Survey 2010. • Bukodi (2009) ‘Education, First Occupation and Later Occupational Attainment: Cross-cohort changes among men and women in Britain’ Centre for Longitudinal Studies Working Paper 2009/4 • Labour Market Statistics May 2012, Office for National Statistics • ONS http://www.ons.gov.uk/ons/rel/mro/news-release/recent-graduates-now-more-likely-to-work-in-lower-skilled-jobs/recentgraduates0312.html • Apprenticeships Statistics 2012 http://www.apprenticeships.org.uk/News-Media/Latest-News/Article070.aspx • Dolphin & Lanning (2011) ‘Rethinking Apprenticeships’ Institute for Public Policy Research • Sigle-Rushton & Perrons (2006) ‘Employment Transitions Over the Life Cycle: a statistical analysis’ Equal Opportunities Commission Working Paper No. 46 • Bastagli & Stewart (2011) ‘Pathways and Penalties: Mothers’ employment trajectories and wage growth in the Families and Children Study’ Centre for Analysis of Social Exclusion, London School of Economics