Download
1 / 36
1.58k likes | 4k Vues
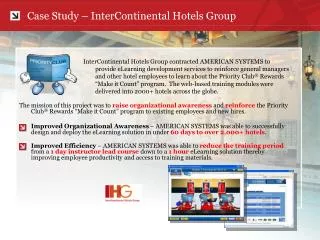
InterContinental Hotels Group. IHG vs. its Main Competitors. Pipeline. Network. Vs end 2009. In ‘000 rooms. Pipeline. In ‘000 rooms. EMEA. APAC. Americas. -3%. 205. 647. 13%. 19%. 68%. 208 Kr. (2) . 138. +6%. 613. 8%. 9%. 83%. 605. 105. +5%. 8%. 7%. 85%.

E N D
IHG vs. its Main Competitors Pipeline Network Vs end 2009 In ‘000 rooms Pipeline In ‘000 rooms EMEA APAC Americas -3% 205 647 13% 19% 68% 208 Kr (2) 138 +6% 613 8% 9% 83% 605 105 +5% 8% 7% 85% Roomsnetworkas of end of year, 2010 Roomspipelineas of end of year, 2010 (1) 103 -5% ~600 10% 4% 86% 1st Worldwide excluding the US 0% 101 507 56% 16% 28% 366Kr 85 0% 495 88% 7% 5% -24% 51 302 61% 20% 19% (1) Hilton geographical breakdown based on 2009 figures (2) Hilton pipeline based on an internal press release, January 2011 NB: Figures include traditional lodging and extended stay units but exclude timeshare products IHG first hotel operator worldwide Slight decrease in most of the pipelines, IHG keeping the highest one Source : Companies annual reports except for Hilton network, Accor internal data
InterContinental Hotels GroupSummary 1. Company overview Slide 4 2. Company organization Slide 5 3. Brand positioning Slide 6 4. Geographical breakdown Slide 7 5. Room portfolio Slide 8 6. Operating mode Slide 9 7. Group strategy Slide 11 8. Pipeline and lodging development Slide 13 9. Key figures Slide 16 10. SWOT analysis Slide 19 11. Company history Slide 20 12. Brands description Slide 21 InterContinental – Company profile FY 2010 3
1. Company overview # rooms segment # hotels RevPAR ADR OR Description Main Shareholders • With brands such as Holiday Inn dating back to the 1950s, Intercontinental Hotel Group (IHG) was formed by the separation of Six Continents on April 2003 • With 4,437 hotels and 647,161 rooms in over 100 countries, IHG is the largest hotel group worldwide • IHG operates 7 brands in the traditional lodging industry and the extended stay segment, from economy to luxury • Economy: Express by Holiday Inn, Candlewood Suites • Midscale: Holiday Inn, Hotel Indigo • Luxury: Intercontinental, Crowne Plaza and StayBridge • Since 2003, IHG has moved to an asset light model, with a focus on franchise and management • Only 15 owned hotels worldwide • Asset sale program £2.9bn worth since 2003 • 335,000 employees Listed on the NYSE and the London Stock Exchange Main Figures Segmental Revenue and Operating Profit Revenue Operating Profit Sources: Reuters as of April 26, 2011, GoogleFinance, Company InterContinental – Company profile FY 2010
2. Company organization Hotel business Other activities Full & Limited service segment Extended Stay segment Award winning loyalty program(Over 51m members worldwide) InterContinental – Company profile FY 2010 5
3. Brand positioning Luxury upscale (29% of room network) 171 h 388 h 188 h Midscale (37% of room network) 1,241 h 6 h 38 h 2,075 h Economy (34% of room network) 288h FullService LimitedService ExtendedStay InterContinental – Company profile FY 2010 6
Luxury 4. Geographical breakdown Hotel and room network 4,437h. / 647,161r. As of December, 31, 2010 Europe,Africa &Middle-East 694 h 120,852 r 68% 19% Americas 3,458 h 439,375 r Asia &Pacific 285h 86,934 r 13% Share ofglobalnetwork Midscale X% Economy InterContinental – Company profile FY 2010 Source: IHG report 2010 7
5. Room portfolio InterContinental – Company profile FY 2010 8
Franchise Management Owned & Leased 6. Operating modeEvolution 2000-2010 Global network per operating mode(In room number) Network 2000497,000 rooms Network 2010647,161 rooms 15h +150,161 rooms or 30% over 9 years InterContinental – Company profile FY 2010 Sources: IHG presentations and annual report 9
Franchise Management Owned & Leased 6. Operating modePer region Regional networks end of December 2010 per operating mode(In room number) Europe, Africa & Middle-East120,852 rooms Americas439,375 rooms Asia & Pacific86,934 rooms 9h 4h 2h Americas and EAME clear focus on franchised hotels Asia and Pacific mainly management contracts InterContinental – Company profile FY 2010 Sources: IHG interim report 10
6. Operating modePer brand, 2010 FY O&L : 7h O&L : 4h O&L : 1h O&L : 2h O&L : 1h InterContinental – Company profile FY 2010 Source: IHG’s FY results 2010
7. Group strategy • Over the last few years: • +1,300 hotels and 150,000 rooms • Focus on the lodging industry • Strong acquisition policy • Worldwide and segment-diversified development • Brand value for customers Network 2000 3,100 hotels 497,000 rooms Network 2010 4,400 hotels 647,000 rooms Objectives • “Making best use of our scale to build and grow preferred hotel brands for guests and owners in high value markets” Action Plan • Target key markets • Build powerful & distinct brands • Implement best demand delivery systems • Have and aligned and engaged organization, with reduced cost and increased efficiency • Play on 3 levers: Rooms, RevPar, Royalty Rate • The most dynamic player with the biggest pipeline, capitalizing on its brands awareness to expand in growing markets • Strategy to penetrate massively Asia, and especially China, while continuing development in key European Countries (UK and Germany in particular) • Emerging globalization of Staybridge Suites and Indigo Hotels brands Conclusion InterContinental – Company profile FY 2010 Sources: IHG presentations 12
7. Group strategyFocus on China InterContinental – Company profile FY 2010
7. Group strategyFocus on India InterContinental – Company profile FY 2010
7. Group strategyFocus on Middle East InterContinental – Company profile FY 2010
7. Group strategyZoom on 2010 key facts Main facts: CrownePlaza transformation :- 4th largest upscale brand worldwide, fastest growing upscale brand in Asia- IHG capital to strengthen distribution (key locations, iconicassets)- Quality drive (c. 40 hotel removals)- Refresh brand hallmarks- Drive brand awareness Holiday Inn relaunch: - entire estate refreshed (90% Holiday Inn and HI Express now operating under the new standards)- new brand extensions (Holiday Inn Club Vacations)- strengthen brand image and reputation (Olympics sponsorship) InterContinental – Company profile FY 2010 Sources: IHG Group at a glance& FY2010 presentation 16
7. Group strategyZoom on 2010 key facts InterContinental – Company profile FY 2010
7. Group strategyZoom on 2010 key facts InterContinental – Company profile FY 2010
Group Pipeline by Operating Mode Group Pipeline by Region Group Pipeline by Brand 8. Pipeline and lodging developmentGeneral overview Development in previous year • In 2010, 35,744 rooms (259 hotels) were added, and 35,262 rooms (260 hotels) removed Development plan as of 31.12.2010 • 1,275 hotels (204,859 rooms) in pipeline • Hotel Indigo outside Americas : 3 hotels open, 16 hotels in the pipeline, 7 new markets including Spain, Thailand, Hong Kong and Taipei • Holiday Inn Express in APAC : 18 hotels signings in 2010 taking pipeline to 40, market entry in India, Japan, Malaysia, Singapore and Taipei A development still focused on Americas and Holiday Inn & Holiday Inn Express InterContinental – Company profile FY 2010 Source: IHG 2010 FY 19
8. Pipeline and lodging developmentPipeline at 31.12.2010 per region Franchise Management Americas890 hotels102,509 rooms EMEA153 hotels31,435 rooms APAC232 hotels70,915 rooms Mgt. 99% Mgt A development plan focused on Franchise and Midscale brands in Americas / Management and Upscale segment abroad InterContinental – Company profile FY 2010 Sources: IHG FY 2010 20
8. Pipeline and lodging developmentFocus on China InterContinental – Company profile FY2009
8. Pipeline and lodging developmentFocus on India and Middle-East India Middle East InterContinental – Company profile FY2009
120 hotels10,506 rooms 123 hotels38,994 rooms 8. Pipeline and lodging developmentPipeline at 31.12.2010 per brand Americas EMEA APAC ExtendedStay 100% 101 hotels10,760 rooms 6% 94% 18% 12% 70% 13% LimitedService 494 hotels57,505 rooms 62 hotels7,627 rooms 14% 75% 11% 16% 44% 40% 313 hotels57,505 rooms Full Service 19% 15% 66% 33% 7% 60% 60 hotels19,374 rooms InterContinental – Company profile FY 2010 Source: IHG FY 2010 results presentation 23
9. Key figuresP&L evolution and forecasts InterContinental – Company profile FY 2010 24
10. SWOT analysis Strength Weaknesses • Very strong brand portfolio with strong brand image (Intercontinental, Express by HI) • Strong development plan in emerging countries such as Russia, China and India • Strong sales network (Internet, travel agents, retailers) • Largest loyalty program: Priority Club Rewards with 56 million members • Cash generative, resilient business model • Weakening share in North America in recent years due to aggressive expansion of main competitors such as Marriott and rationalization of network • Reliability upon hotel sales within travel and tourism • Weak financial performance, with decreasing revenues Opportunities Threats • Development of Internet sales facilities and marketing activities as opportunities to further develop revenues through this medium • Considerable opportunities in emerging regions, such as Eastern Europe and Asia-Pacific • Extended stay segment as a fast growing and profitable segment • Currency fluctuations particularly in case of a weak US Dollar. Uncertain Market conditions. • Threats of competition coming from budget and economic segments on Holiday Inn Express brand • New innovating concepts on the midscale segment facing ageing Holiday Inn InterContinental – Company profile FY 2010
12. Company history 2008 Launch of Holiday Inn Club Vacations 2007 Relaunch program of the Holiday Inn Brand family 1998 2006 2005 Operating JV with All Nipon Airways (ANA), IHG ANA Hotels Group Japan, Launch of Staybridge UK 2004 Launch of Hotel Indigo Creation of the InterContinental Hotels Group, listed on the NY- and London Stock Exchange. The restaurant and pubs part of Six Continents became Mitchells & Butlers plc. Launch of Candlewood Suites 2003 Change of name into Six Continents Acquisition of Southern Pacific Hotels (Australia) & the Bristol Hotels & Resorts Inc (US) Acquisition of the European Posthouse chain of hotels (UK and Europe) Acquisition of the Intercontinental Hong Kong (China, Asia Pacific) 2000 2001 The Intercontinental Hotel Co 1994 Launch of Crowne Plaza (upscale move) Move to franchise operating model Launch of Staybridge Suites in North America 1997 1991 Launch of Holiday Inn Express 1990 Acquisition of the North American Holiday Inn 1988 First move into the hospitality industry with the buying of Holiday Inns International 1977 W. Bass sets up a brewery developing since 1960 1777 Birth of the company InterContinental – Company profile FY 2010 Source: Company website
12. Brands description InterContinental – Company profile FY 2010 Source: IHG’s FY results 2010
12. Brands descriptionFull-service – InterContinental Hotels Resorts EAME Americas APAC Overview Network Full-service, luxury and upper-upscale brand • InterContinental's global flagship brand, primarily serving international business and leisure travelers • Key figures FY 2010 • ADR: $189 • RevPar: $125 • Occupancy Rate: 66% Main competitors • Sofitel, Westin, JW Marriott H&R, Hilton, Park Hyatt • Network • 171 hotels / 58,429 rooms in operation= 341 rooms per hotel on average Locations • in major cities and resort locations • Geographical breakdown • more than 60 countries FY 2009 • ADR: $179 • RevPar: $112 • Occupancy rate: 63% InterContinental – Company profile FY 2010 Source: Company website & reports
12. Brands descriptionFull-service – Crowne Plaza Hotels & Resorts EAME Americas APAC Overview Network Full-service, upscale brand • Targeting mainly business travelers due to high-level of business amenities • “Sleep advantage” programme in North America and EMEA • Co-branded ANA Crowne Plaza hotels open in Japan • Strong pipeline • Key figures FY 2010 • ADR: $111 • RevPar: $71 • Occupancy Rate: 64% Main competitors • Pullman, Sheraton, Doubletree, Renaissance, Grand Hyatt • Network • 388 hotels / 106,155 rooms in operation= 274 rooms per hotel on average Locations • mainly in major getaway cities or in resort locations • Geographical breakdown • 50 countries FY 2009 • ADR: $109 • RevPar: $66 • Occupancy rate: 60% InterContinental – Company profile FY 2010 Source: Company website & reports
12. Brands description Full-service – Holiday inn Hotels & Resorts EAME Americas APAC Overview Network Full-service, midscale brand • The world’s most recognized midscale brand. Hotels outside the US market are often of a better range than inside • Key figures FY 2010 • ADR: $99 • RevPar: $61 • Occupancy Rate: 62% Main competitors • Novotel, Courtyard, Ramada, Hyatt Place • Network • 1,241 hotels / 227,225 rooms in operation= 183 rooms per hotel on average Locations • no particular area requirements • Geographical breakdown • 50 countries FY 2009 • ADR: $95 • RevPar: $54 • Occupancy rate: 56% InterContinental – Company profile FY 2010 Source: Company website & reports
12. Brands description Limited-service – Hotel Indigo Overview Network Limited-service, midscale brand • Innovative design and concept, targeting mainly business travelers • Boutique Hotel brand launched in 2004 • Key figures FY 2010 • ADR: $107 • RevPar: $65 • Occupancy Rate: 61% Main competitors • Aloft • Network • 38 hotels / 4,548 rooms in operation= 121 rooms per hotel on average Locations • urban and nearly-urban locations • Geographical breakdown • 35 hotels in the US • Increasing international expansion: 62 hotels in the pipeline, including 5 hotels in APAC and 11 in EMEA FY 2009 • ADR: $106 • RevPar: $58 • Occupancy rate: 55% InterContinental – Company profile FY 2010 Source: Company website & reports
12. Brands description Limited-service – Holiday Inn Express (1/2) EAME Americas APAC Overview Network Limited-service, economic brand • Key figures FY 2010 • ADR: $94 • RevPar: $59 • Occupancy Rate: 63% Main competitors • Ibis, Hampton, Fairfield Inn • Network • 2,075 hotels / 191,228 rooms in operation= 92 rooms per hotel on average • Geographical breakdown • 73 countries FY 2009 • ADR: $92 • RevPar: $56 • Occupancy rate: 60% InterContinental – Company profile FY 2010 Source: Company website & reports
12. Brands description Limited-service – Holiday Inn Express (2/2) Spin-Off Of A Flagship Brand : case study • Holiday Inn Express : the most brilliant success of spin-off • Creation • Holiday Inn in 1952 • Holiday Inn Express in 1991 (roll out in Europe in 1996) • Positioning • Complementary brand to Holiday Inn (full service, midscale) on the economy segment (limited services) • Rooms look roughly the same • Differences in the extent of the hotel’s services and amenities • Branding • 2 names used: Holiday Inn Express vs. Express by Holiday Inn outside the US and the UK • But current transformation to Holiday Inn Express worldwide • Existing network (end 2010): • Holiday Inn Express = 2,075 h. / 191 kr. • Holiday Inn = 1,241 h. / 227 kr. • A thriving brand with an incredibly quick development : larger network than Holiday Inn
12. Brands description Extended stay – Staybridge Suites EAME Americas Overview Network Extended stay, upscale brand • Key figures FY 2010 • ADR: $95 • RevPar: $68 • Occupancy Rate: 72% Main competitors • Residence Inn • Network • 188 hotels / 20,762 rooms in operation= 110 rooms per hotel on average • Geographical breakdown • In the US and recently launched in the UK 8 countries FY 2009 • ADR: $97 • RevPar: $65 • Occupancy rate: 67% InterContinental – Company profile FY 2010 Source: Company website & reports
12. Brands description Extended stay – Candlewood Suites Overview Network Extended stay, midscale brand • Key figures FY 2010 • ADR: $62 • RevPar: $43 • Occupancy Rate: 69% Main competitors • Suitehotel, Homewood Suites • Network • 288 hotels / 28,253 rooms in operation= 98 rooms per hotel on average • Geographical breakdown • Only in North America FY 2009 • ADR: $66 • RevPar: $42 • Occupancy rate: 64% InterContinental – Company profile FY 2010 Source: Company website & reports