Download
1 / 22
220 likes | 320 Vues
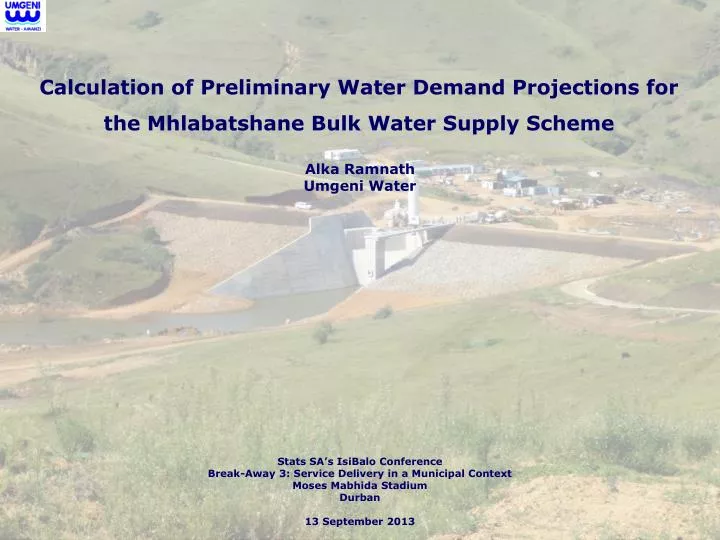
Calculation of Preliminary Water Demand Projections for the Mhlabatshane Bulk Water Supply Scheme. Alka Ramnath Umgeni Water. Stats SA’s IsiBalo Conference Break-Away 3: Service Delivery in a Municipal Context Moses Mabhida Stadium Durban 13 September 2013. Purpose.

E N D
Calculation of Preliminary Water Demand Projections for the Mhlabatshane Bulk Water Supply Scheme AlkaRamnath Umgeni Water Stats SA’s IsiBalo Conference Break-Away 3: Service Delivery in a Municipal Context Moses Mabhida Stadium Durban 13 September 2013
Purpose • Show how the preliminary water demand projections for the Mhlabatshane Bulk Water Supply Scheme were calculated.
Demographics: - Census 2001 Not to scale
Demographics: - DWA’s WSNIS (2011) Not to scale
Eskom Building Count 2008 Not to scale
Demographics: - Ugu’s Infrastructure Audit 2011 Not to scale
Table 4 Number of households per Supply Zone (Ugu Infrastructure Audit 2011).
Comparison of the Demographic Datasets Table 5 Comparison of the number of people per Supply Zone.
Table 6 Comparison of the number of households per Supply Zone.
Demographic Projections • Projection horizon = 30 years. • Rates Table 7 Rates used for the population scenarios.
Scenarios Table 8 DBSA High AIDS Scenario (Eskom Building Count 2008 and Assuming Average Household Size of 5).
Table 9 DBSA Low AIDS Scenario (Eskom Building Count 2008 and Assuming Average Household Size of 5).
Table 10 Middle Scenario (Eskom Building Count 2008 and Assuming Average Household Size of 5).
Table 11 Growth Rate = 0.3 (Eskom Building Count 2008 and Assuming Average Household Size of 5).
Water Projections • Assumptions: • Water consumption pattern – income levels. • Average daily consumption per capita (kl/c/day) = 0.075 • Water losses = 1.3
Lessons Learnt • Household size and income distribution useful. • Mid-Year Population Estimates. • Evidence-based planning, users appear more comfortable with a Building Count dataset. • Unavailability of datasets at required scale for the Component Method of population projections.