Download
1 / 12
120 likes | 307 Vues
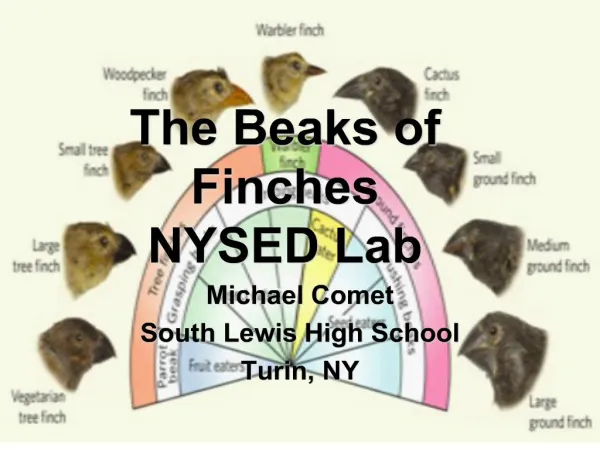
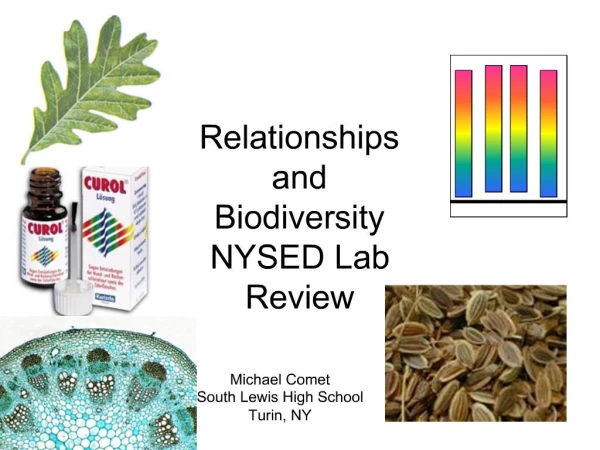
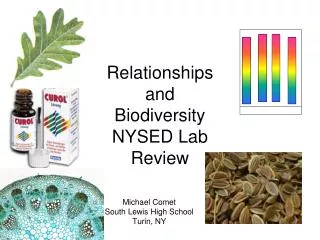
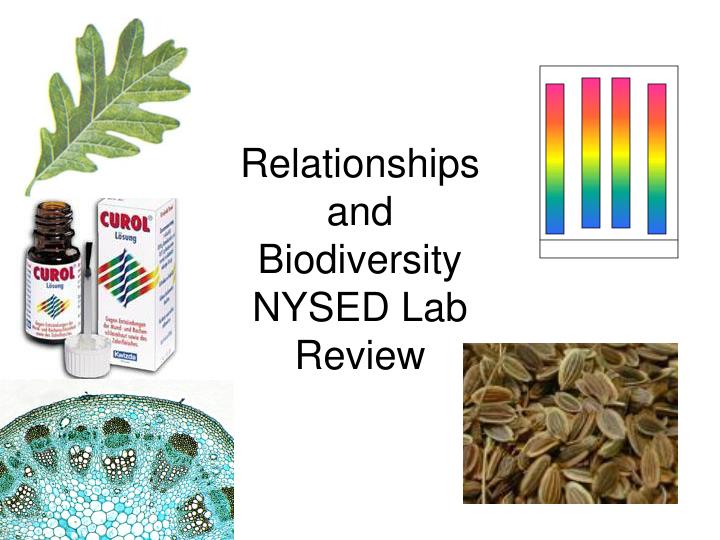
Relationships and Biodiversity NYSED Lab Review. What does this lab entail?. Seven tests that look at the physical, chemical, and microscopic characteristics of three plants that may be able to create Curol, even though they are not Botana curus (the plants that does produce it).

E N D
What does this lab entail? • Seven tests that look at the physical, chemical, and microscopic characteristics of three plants that may be able to create Curol, even though they are not Botana curus (the plants that does produce it). • Comparison of data to determine relationships. • Define the crucial need for biodiversity.
Test 1 - Structural Characteristics of Plants Goal: Compare the leaf structure of z, y and x to BotanaCurus Species Z Botana curus Species Y Species X
Test 2 – Structural Characteristics of Seeds QUESTION: Which seeds most closely resemble the seeds produced by Botana curus? Record your observations in the data table. Botana curus seeds Species X seeds Species Y seeds Species Z seeds
Test 3 – Microscopic Internal Structures of Stems QUESTION: Which stem structures most closely resemble the stem structures of Botana curus? Record your observations in the data table. Species X Botana curus Species Y Species Z
Paper Chromatography • This is a test to compare the molecule make up of plants. The paper separates the molecules for comparison.
Test 4 – Paper Chromatography to Separate Plant Pigments Water moves up paper and carries the separated molecules which help us compare plant similarities by their molecule make up B.curus X Y Z B.curus X Y Z “Spot” your chromatography paper and label it with a pencil.
Test 5 – Indicator Tests for Enzyme M Botana curus Botana curus (“fizzed” a little) Species X Species X (no “fizz”) Indicator Enzyme M Species Y Species Y (“fizzed” a little) Species Z Species Z (“fizzed” a little) Add a small sprinkle of “Indicator Enzyme M” Put two drops of each plant Extract in separate wells of the well tray. Record your results.
Test 6 – Using Simulated Gel Electrophoresis to Compare DNA The strips below represent the DNA strands extracted from each plant (B. curus, X, Y, and Z). Each strand will be “cut” between a double C/double G. Therefore, lines are drawn below where each strip should be cut. Then, count up the number of bases and paste appropriately in the simulated Gel Electrophoresis table on the next slide. Botana curus A T T C C G G A T C G A T C G C C G G A T A T A C T C C G G T A A T A T C Species X A T T G T A C C G G G A T C C G G A C G T C G C G A C T A A T A T A G C A Species Y A C C G G T C C G G G A T C G C A C C C G G T A C T C C T G T A A T A T C Species Z A T T C C G G A T C G A T C G C C G G A T A T T C T C C G G T A A T A T
And where did you get those Amino Acids from??? Your friend and mine… The Universal Genetic Code Chart