Download
1 / 12
120 likes | 297 Vues
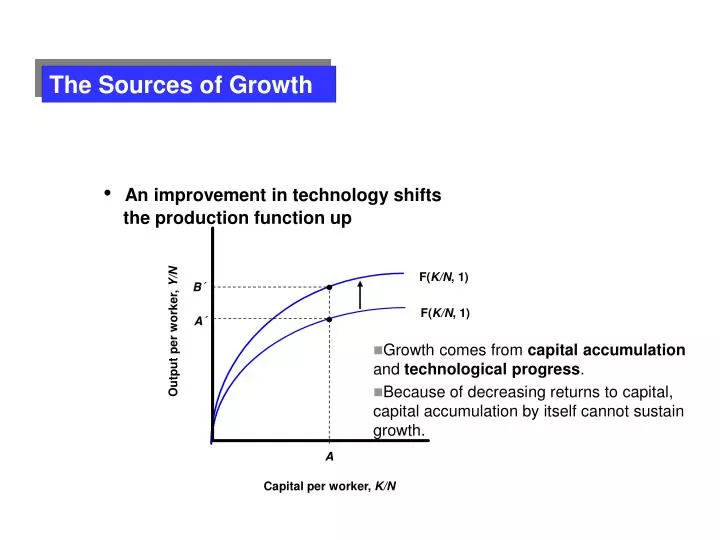
F( K/N , 1). F( K/N , 1). B´. A´. Output per worker, Y/N. A. Capital per worker, K/N. The Sources of Growth. An improvement in technology shifts the production function up. Growth comes from capital accumulation and technological progress .

E N D
F(K/N, 1) F(K/N, 1) B´ A´ Output per worker, Y/N A Capital per worker, K/N The Sources of Growth • An improvement in technology shifts • the production function up • Growth comes from capital accumulation and technological progress. • Because of decreasing returns to capital, capital accumulation by itself cannot sustain growth.
Interactions between Output and Capital • Capital, Output, and Saving/Investment • The amount of capital (K) amount of output (Y) • The amount of output (Y) the amount of savings (S) & investment (I = S when G-T=0) amount of capital (K) • ΔK = I – Depreciation = sY - δK
Change in capitalfrom year t to year t+1 Invest-ment during year t depreciationduring year t - = Interactions between Output and Capital Per worker output and capital accumulation Capital/worker in t+1 = Capital/Worker in t, adjusted for depreciation and investmentInvestment/worker = Savings rate x Output/worker in t
Depreciation per worker Kt/N Output per worker f(Kt/N) Y*/N B Investment per worker sf(Kt/N) C D A Dynamics of Capital and Output Graphically Output per worker, Y/N AB = Output/worker AC = Investment/worker AD = Depreciation AC > AD (Ko/N) K*/N Capital per worker, K/N
Steady-State Value of Capital/Worker: Investment just offsets depreciation Steady-State Value of Output/Worker Steady-State Capital and Output
Depreciation per worker Kt/N Output per worker f(Kt/N) D Y1/N B Investment s0f(Kt/N) Investment s1f(Kt/N) Y0/N C I > Output per worker, Y/N A (K0/N) K1/N Capital per worker, K/N The Effects of Different Saving Rate
Y1/N Output per worker, Y/N Y0/N Time The Effects of Different Saving Rate (No technological progress) Associated with saving rate s1 > s0 Associated with saving rate s0 t
Associated with saving rate s1 > s0 Output per worker, Y/N (log scale) Associated with saving rate s0 Time The Effects of Different Saving Rate (Technological progress) t
The Savings Rate and the Golden Rule Does an increase in saving lead to an increase inconsumption in the long run? Two Scenarios: • Saving Rate = 0 • Capital = 0 • Output = 0 • Consumption = 0 • Saving Rate = 1 • Consumption = 0 • Output replaces depreciation
Maximum steady state Consumption per worker: At Golden Rule Level of Capital Consumption per worker, C/N Saving rate, s Implications of Alternative Saving Rates sG 0 1
Assume: (Constant return to scale and decreasing returns to either capital or labor) In steady-state is constant and the left side= 0 and: Then Double s Quadruple K/N and double Y/N
The U.S. Saving Rate and the Golden Rule What saving rate that would maximize steady-state consumption? In Steady-State: If s < .50: increasing s will increase long-run consumption In the U.S., s < 20%