Download
1 / 10
100 likes | 166 Vues
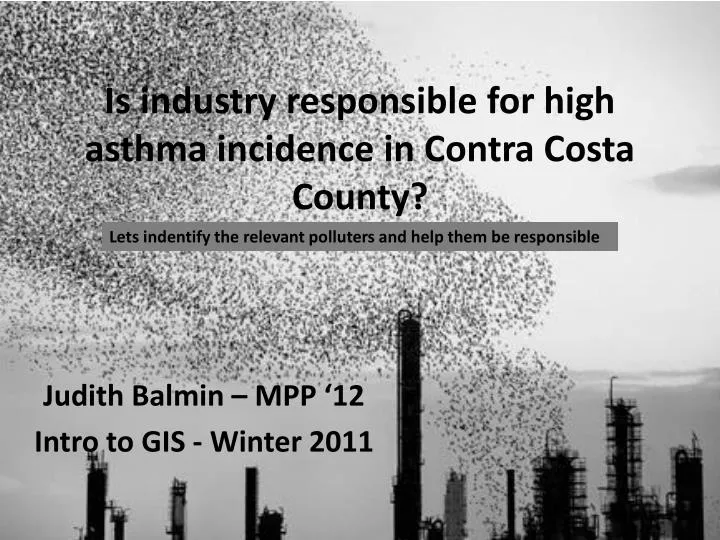
Is industry responsible for high asthma incidence in Contra Costa County?. Lets indentify the relevant polluters and help them be responsible. Judith Balmin – MPP ‘12 Intro to GIS - Winter 2011. CCC is north of Oakland in the SF Bay Area. It is home to great diversity.

E N D
Is industry responsible for high asthma incidence in Contra Costa County? Lets indentify the relevant polluters and help them be responsible Judith Balmin – MPP ‘12 Intro to GIS - Winter 2011
CCC is north of Oakland in the SF Bay Area. It is home to great diversity As well as to oil refineries, chemical plants—over all 31 different sites registered with EPA TRI program Total population in 2008: 1,029,703
How bad is it? • CCC does indeed have an asthma problem. They 6,630 ED visits for asthma in 2008, which is amongst the highest in California. Their lifetime prevalence is 14.5% which is midrange amongst other California counties. • CA Department of Public Health identified many factors that cause asthma including mold, tobacco, ozone exposure, different kinds of pollution–I’m looking at the last one
Lets look at the obvious equity issue for a moment: Wealthier households are not located near industry and subsequently are not as directly exposed to harmful emissions that Department of Health identifies as factors in why people get asthma.
The worst polluters are all refineries except for one. The CA Dept Of Heath sites pollution from petrochemicals sources as a major factor that causes asthma.
But letsnot be hasty… Nothing shocking was revealed by the TAC index. The biggest general TRI emitters are emitting the most TACs as well. Asthma suffers need only worry about 10,000s of tons of TACs instead of 100,000s of TRIs (unless they are worried about Cancer also. That’s a different story). Iderived the TAC index by isolating the substances amongst the TRI substances that are defined by the CA EPA Air Resources Board to be Toxic Air Contaminants. These are: Lead, Nickel, Ethylene, Carbon Tetrachloride, Benzene, and Chloroform.
Not exactly what I was hoping to do, but here we can see which sites are in close proximity to low income areas and the highest incidence of residents experiencing asthma symptoms
Policy Questions • Can we recognize the areas where people are the most stuck with the worst pollution? • How can these refineries minimize their health impact on surrounding residents? • In the past when there have been a fires/explosions/flaring at refineries in CCC, residents have been monetarily compensated for being exposed to toxic ash and smoke. How does that compensation compare with their real medical costs?
Skills used • Inset Map – slide 2 • Point Graduated Symbol – slide 4 • Geocoding – slide 4, • Creating Indices – slide 7, Toxic Air Contaminants index created from individual qualifying substances • Buffer – 8 (I wanted to “prorate” but turned out I didn’t have the right kind of data and was only able to “intersect”. From what I understand.) • Geoprocessing – Clipping all throughout