Download
1 / 28
280 likes | 375 Vues
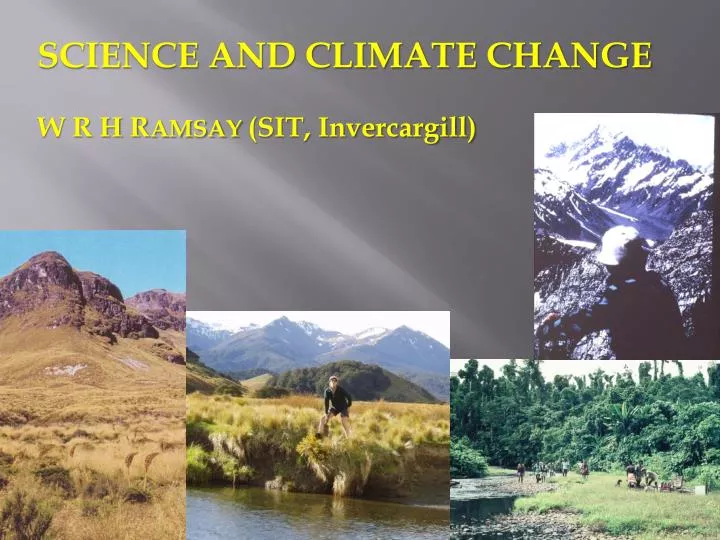
SCIENCE AND CLIMATE CHANGE W R H R AMSAY (SIT, Invercargill). One of New Zealand’s most famous scientists, W. S. Fyfe FRS stated at the International Geological Congress in 1976 that we could not continue to burn fossil fuels at the rate we have been

E N D
SCIENCE AND CLIMATE CHANGE W R H RAMSAY (SIT, Invercargill)
One of New Zealand’s most famous scientists, W. S. Fyfe FRS stated at the International Geological Congress in 1976 that we could not continue to burn fossil fuels at the rate we have been He urged us to watch two countries which had decided to generate a significant component of energy by nuclear methods – Japan and France Currently France generates some 78% electricity by way of nuclear energy
The IPCC in 2007 released its 4th Assessment Report • Two of its conclusions were, • Warming has occurred over the last 100 years • Most of this increase in average global temperatures is most likely due to increases in anthropogenic greenhouse gases • Considerable debate continues in scientific circles as to what component of this warming is due to natural forcing and what component is due to human activity
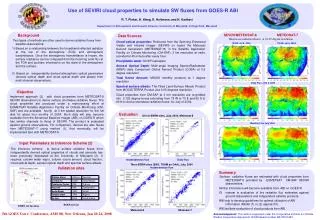
Carbon budgets on Earth and Venus Earth and Venus are comparable planets belonging to the ‘terrestrial planetary group’ Both have similar masses with similar estimated carbon levels but the manner in which they store this carbon (carbon reservoirs) has resulted in very different atmospheres
Venus 645 W/m2 incoming solar radiation 130 W/m2 solar radiation reaches the surface Earth 342 W/m2 incoming solar radiation 242 W/m2 solar radiation reaches the surface After Ruddiman (2008)
Triple point of water After Merritts et al., 1997
Geological evidence indicates that Earth has been able to maintain its surface temperature close to the ‘triple point’ of water for the last 3.7 BY All three phases of water have co-existed on the Earth’s surface since 3.6 - 3.7 BYBP
Earth’s apparent ability to maintain its surface temperature close to the triple point of water • Removal of atmospheric CO2 through chemical weathering • Gaia hypothesis • 2a. Extreme Gaia hypothesis (Lovelock and Margulis) • 2b. Modified Gaia hypothesis
Chemical weathering and the Earth’s internal thermostat • During warm periods with higher atmospheric greenhouse gases chemical weathering of rocks increases • During colder periods with less greenhouse gases chemical weathering of rocks decreases • H2O + CO2 + CaSiO3 → H2CO3 + CaO + SiO2 • H2CO3 + CaO → CaCO3↓ + H2O • CO2 is removed as CaCO3 and deposited in oceanic basins as pelagic oozes, limestones, and organic shell matter
Gaia hypothesis • James Lovelock and Lynn Margulis during the 1980s proposed that the evolution on life was capable of regulating Earth’s climate • Extreme Lovelock and Margulis theory which claims that evolution has occurred for the good of planet Earth and its atmosphere • Less extreme view that organisms have played a role in developing the physical/chemical Earth processes and Earth’s climate
Gaia hypothesis First vascular land plants Marine organisms with shells Ediacara fauna Oxygen levels increase and Fe++ oxidised to Fe+++ Earliest stromatolites Water condenses on Earth’s surface Formation of Earth Images from R & M Morrison (1990)
Climate change over the last 1000 million years Geological evidence indicates that there have been a number of glacial and interglacial periods over the last 1000 million years (= 1 BYBP) Glacial deposits from the Sturtian Glacial event (700 MYBP), Flinders Ranges
What caused the last deglaciation at around 15,000 years ago? • By 10,000 the angle of the Earth’s tilt had reached a maximum • By 10,000 the Earth’s precessional motion moved it closest to the sun on June 21st • Rise in summer insolation at higher latitudes (Milankovitch theory) = significant ice melting • Increase in CO2 levels from 190 to 280 ppm • Doubling of methane levels • Melting ice sheets raised global sea levels by 110-125 m
Possible causes of the last deglaciation After Ruddiman (2008)
Methane, carbon dioxide, and temperature variations over the last 160,000 years – Vostok ice core After Skinner, Porter and Bokin (1999)
Glacial ice sheets over North America - 20,000 YBP After Skinner, Porter, and Botkin (1999)
Ice sheet retreat over North America 18,000 – 6,000 YBP After Ruddiman (2008)
Two competing theories Milankovitch theory that insolation controls the ice sheets Kutzbach theorythat insolation controls tropical monsoons Current evidence supports both theories: Rising summer insolation in the northern hemisphere initiated ice sheet melting around 15,000 YBP Rising summer insolation strengthened tropical monsoons Since 7,000YBP there has been decreasing summer insolation and this has coincided with cooling at high northern latitudes and weakening of monsoonal activity
The last 7000 years • Superimposed on this period of global cooling which commenced some 7,000 YBP we have over the last 1000 years the following:- • Localised evidence for a Medieval warming period ~ 1000 – 1350 AD • Localised evidence for a mini ice age ~1500 – 1850 AD • World-wide evidence for a period of warming since 1850 AD
Concern over melting of methane-bearing clathrates After Ruddiman (2008)
Comment and future predictions • Continued consumption of fossil fuels will increase atmospheric CO2 levels • Estimations indicate that atmospheric CO2 levels will increase at least twice to four times over the next 100 years • Best science indicates that over the last 200 years global-average surface temperatures have increased ~ 0.7 - 1OC • Since 1880 the Arctic region has warmed by ~2OC • During September 2007 the ‘Northwest Passage’ was open for several weeks • Currently the major scientific debate revolves around what % of climatic warming can be attributed to epoch, orbital, and millennial-scale processes and what % warming over the last century is the result of human activity
Epilogue Khilyuk and Chilingar (2006) estimate that human greenhouse forcing is four to five orders of magnitude less than the major natural forcing events
References Carter R. M., 2007: The myth of human-caused climate change. AusIMM New Leaders Conference, Brisbane. Khilyuk L. F. and Chilingar G. V. 2006: On global forces of nature driving the Earth’s climate. Are humans involved? Environmental Geology, v. 50, pp. 899-910. Merritts D., de Wit A., and Menking K., 1998: Environmental geology: An Earth systems approach. W H Freeman and Co., New York. 452 pages. ISBN: 0716728346. Morrison R., and Morrison M., 1990: Australia: The four billion year journey of a continent. Weldon Publishing, 334 pages. ISBN: 1 87511341X. Ruddiman W. F., 2008: Earth’s climate past and future, 2nd Edition. W. H. Freeman and Co., New York. 388 pages. ISBN: 0716784904. Skinner B., Porter S. C., and Botkin D. B., 1999: The blue planet. John Wiley & Sons, Inc., 552 pages. ISBN: 0471161144.