Download
1 / 14
140 likes | 223 Vues
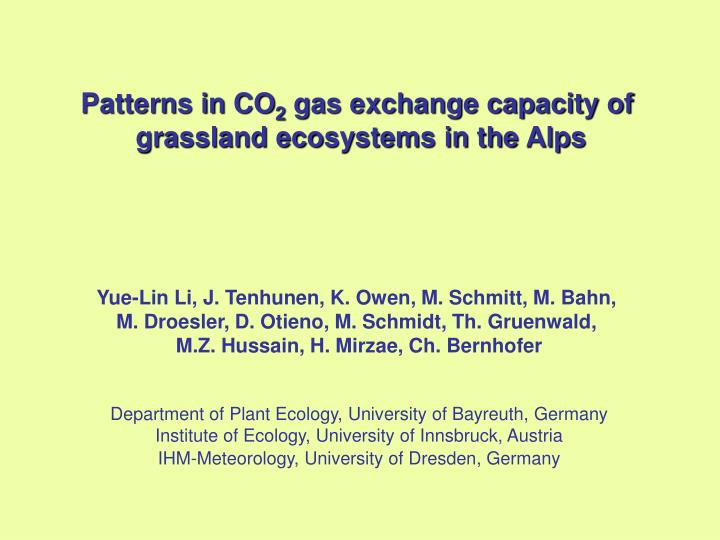
Patterns in CO 2 gas exchange capacity of grassland ecosystems in the Alps. Yue-Lin Li, J. Tenhunen, K. Owen, M. Schmitt, M. Bahn, M. Droesler, D. Otieno, M. Schmidt, Th. Gruenwald, M.Z. Hussain, H. Mirzae, Ch. Bernhofer Department of Plant Ecology, University of Bayreuth, Germany

E N D
Patterns in CO2 gas exchange capacity of grassland ecosystems in the Alps Yue-Lin Li, J. Tenhunen, K. Owen, M. Schmitt, M. Bahn, M. Droesler, D. Otieno, M. Schmidt, Th. Gruenwald, M.Z. Hussain, H. Mirzae, Ch. Bernhofer Department of Plant Ecology, University of Bayreuth, Germany Institute of Ecology, University of Innsbruck, Austria IHM-Meteorology, University of Dresden, Germany
A: Berchtesgaden Locations S N Y3 Y2 Y1 Y0 Stubai Valley: Y0 Intensive Meadow 1000 m Y1 Extensive Meadow 1750 m Y2 Pasture 1950 m Y3Abandoned 1960m S X3 X2 X1 N X0 Berchtesgaden National Park: X0 Schönau, Intensive Meadow 620 m X1 Hirschengarten, Pasture 1020 m X2 Kühroint, Pasture 1420 m X3 Kederbichl, Forest Understory 1750 m Fig.1 B: Stubai Valley Locations
Low elevation sites High elevation sites
10 y = 0.93 x 2 R = 0.59 0 -30 -20 -10 0 10 -10 -20 Grillenburg Estimated -10 -5 0 -30 0 Actual -5 -10 y = 0.96 x R 2 = 0.43 2004 NEE estimated, mmol CO2 m-2 s-1 Day of Year NEE measured, mmol CO2 m-2 s-1 0 60 120 180 240 300 360 2004 4 2 0 -2 Carbon Gain in Light Period, g C m-2 d-1 -4 -6 -8 -10
Separation of CO2 exchange by components of a herbaceous vegetation mosaic and up-scaling via chamber plus eddy covariance measurements in the Portuguese montado John Tenhunen, Yuelin Li, Heydar Mirzaei, Mir Zaman Hussain Department of Plant Ecology, University of Bayreuth, Germany Lukas Siebicke, Thomas Foken Department of Micrometeorology, University of Bayreuth, Germany Joao Banza, Joao Pereira Instituto Superior de Agronomia, Technical University of Lisbon, Portugal Luis Aires, Casimiro Pio CESAM and Department of Environment, University of Aveiro, Portugal
H 100 H m U Ca. B L A C E
Empirical Canopy Model: Canopy Fixation Capacity Light Use Efficiency Ecosystem Respiration Capacity Soil Influence Day of Year 200x? FLUXNET Soil Matric potential (cm) -45 2003 -55 -65 Day of Year -75 -85 60 120 180 240 300 360 0 Climate NDVI (for LAI) Management? Crops and Grasslands