Download
1 / 7
70 likes | 192 Vues
https://www.youtube.com/watch?v=14-RZUOlYIY<br>https://www.youtube.com/watch?v=rY9wxXKFXMI<br>https://www.youtube.com/watch?v=o0r-xN_Z88Q

E N D
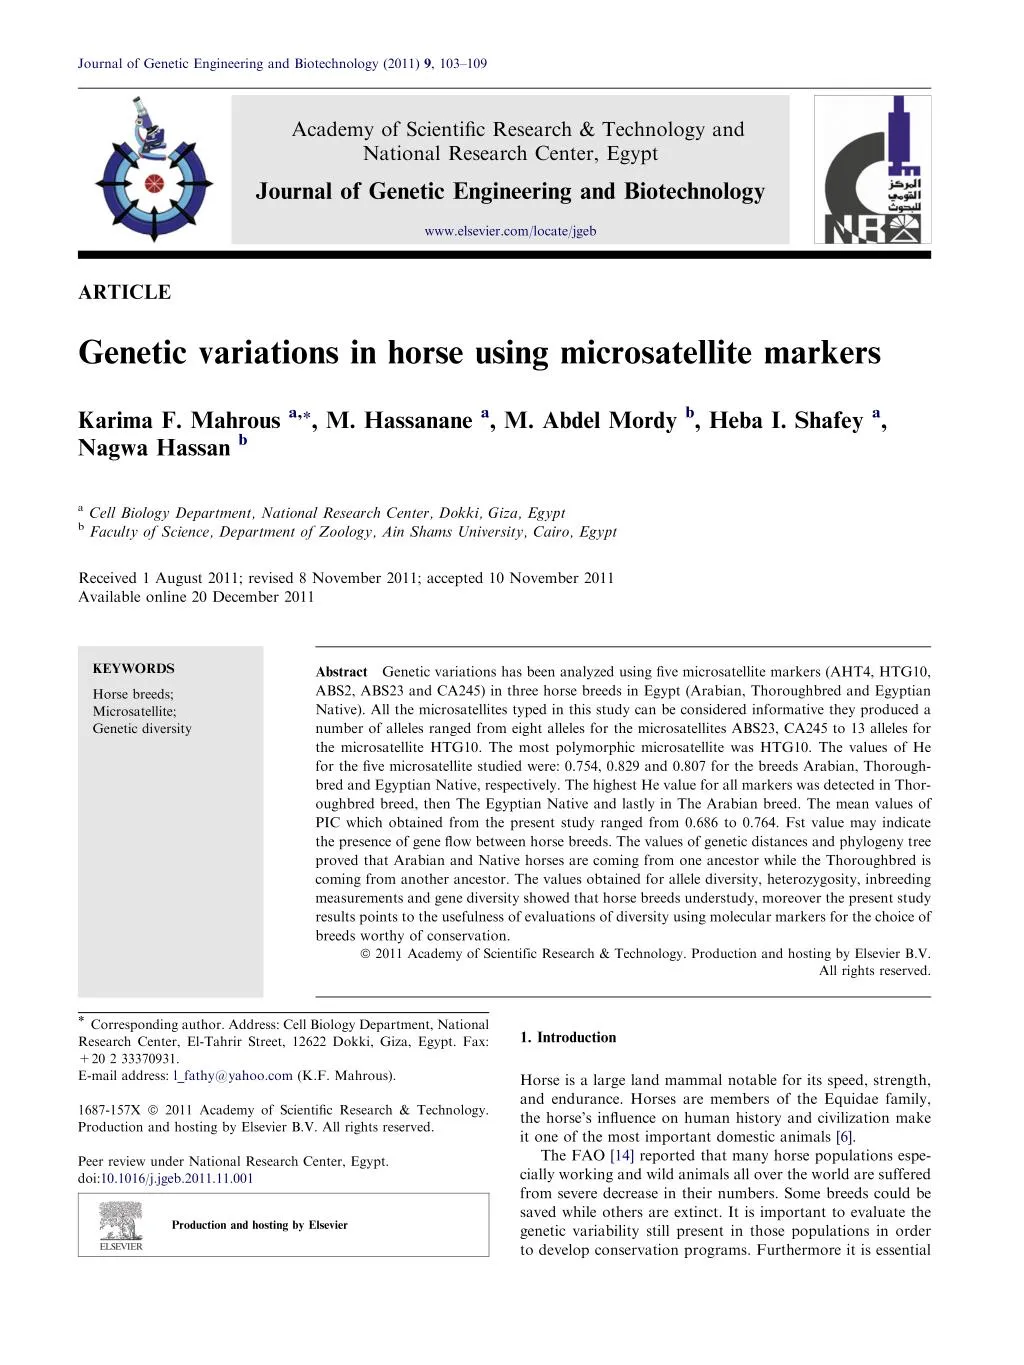
Journal of Genetic Engineering and Biotechnology (2011) 9, 103–109 Academy of Scientific Research & Technology and National Research Center, Egypt Journal of Genetic Engineering and Biotechnology www.elsevier.com/locate/jgeb ARTICLE Genetic variations in horse using microsatellite markers Karima F. Mahrousa,*, M. Hassananea, M. Abdel Mordyb, Heba I. Shafeya, Nagwa Hassanb aCell Biology Department, National Research Center, Dokki, Giza, Egypt bFaculty of Science, Department of Zoology, Ain Shams University, Cairo, Egypt Received 1 August 2011; revised 8 November 2011; accepted 10 November 2011 Available online 20 December 2011 KEYWORDS Abstract ABS2, ABS23 and CA245) in three horse breeds in Egypt (Arabian, Thoroughbred and Egyptian Native). All the microsatellites typed in this study can be considered informative they produced a number of alleles ranged from eight alleles for the microsatellites ABS23, CA245 to 13 alleles for the microsatellite HTG10. The most polymorphic microsatellite was HTG10. The values of He for the five microsatellite studied were: 0.754, 0.829 and 0.807 for the breeds Arabian, Thorough- bred and Egyptian Native, respectively. The highest He value for all markers was detected in Thor- oughbred breed, then The Egyptian Native and lastly in The Arabian breed. The mean values of PIC which obtained from the present study ranged from 0.686 to 0.764. Fst value may indicate the presence of gene flow between horse breeds. The values of genetic distances and phylogeny tree proved that Arabian and Native horses are coming from one ancestor while the Thoroughbred is coming from another ancestor. The values obtained for allele diversity, heterozygosity, inbreeding measurements and gene diversity showed that horse breeds understudy, moreover the present study results points to the usefulness of evaluations of diversity using molecular markers for the choice of breeds worthy of conservation. ª 2011 Academy of Scientific Research & Technology. Production and hosting by Elsevier B.V. Genetic variations has been analyzed using five microsatellite markers (AHT4, HTG10, Horse breeds; Microsatellite; Genetic diversity All rights reserved. *Corresponding author. Address: Cell Biology Department, National Research Center, El-Tahrir Street, 12622 Dokki, Giza, Egypt. Fax: +20 2 33370931. E-mail address: l_fathy@yahoo.com (K.F. Mahrous). 1. Introduction Horse is a large land mammal notable for its speed, strength, and endurance. Horses are members of the Equidae family, the horse’s influence on human history and civilization make it one of the most important domestic animals [6]. The FAO [14] reported that many horse populations espe- cially working and wild animals all over the world are suffered from severe decrease in their numbers. Some breeds could be saved while others are extinct. It is important to evaluate the genetic variability still present in those populations in order to develop conservation programs. Furthermore it is essential 1687-157X ª 2011 Academy of Scientific Research & Technology. Production and hosting by Elsevier B.V. All rights reserved. Peer review under National Research Center, Egypt. doi:10.1016/j.jgeb.2011.11.001 Production and hosting by Elsevier
104 K.F. Mahrous et al. (El-Jezirah club) and 20 samples from Native Egyptian breed (Nazlet El-Seman)}. The blood sample was collected on a tube supplied with 0.5 ml of 0.5 M EDTA (as an anticoagulant). DNA was extracted and purified from whole blood using the salting out technique described by Miller et al. [28]. DNA con- centration was determined using a UV spectrophotometer at optical density of 260 nm. The Five microsatellite studied were chosen according to a joint meeting recommendation, between the International Society of animal genetics (ISAG) and FAO [15], for genetic diversity studies (Table 1). Polymerase chain reaction was performed using 20 ll for each sample with specific microsatellite marker, primary dena- turation: 95 ?C for 3 min followed by 35 cycles as: 95 ?C for 15 s, 55–60 ?C for 30–60 s, 72 ?C for 30 s. Final extension: 72 ?C for 5 min, Storage: 15 ?C. For optimization the PCR the temperature and the time of the annealing temperature were changed. The success of PCR was detected on 2% aga- rose after running in horizontal electrophoresis set and stain- ing with ethidium bromide. The products of the successful PCRs were characterized un- der denaturing conditions on 12% polyacrylamide vertical electrophoresis [33]. After the end of the run, the polyacryl- amide gels were stained by ethidium bromide solution (0.5 lg/ml TBE buffer). The gel image was captured electron- ically using Biometra Gel documentation system. The allele sizes were determined using free software named Lab. image V2.7. It is dispersed free from Proland company (Germany), from the internet through the web page: http://www.labimag- ing.com/servlet/engine/home/start.html. to construct phylogenic trees and to establish the relationship among different horse populations in order to deepen our understanding of evolution and domestication of the horse [24]. In the last decade microsatellite markers have been widely used to assess genetic variability within and between different horse breeds [1]. The Arabian horse is a breed of horse with a reputation for intelligence, spirit, and stamina, throughout history, Arabian horses from the Middle East spread around the world by both war and trade, used to improve other breeds by adding speed, refinement, endurance, and good bone [9]. The Thoroughbred is a horse breed best known as a racehorse, The Thoroughbred asitisknowntodaywasdevelopedduringthe17thand18thcen- turiesinEnglandwhenNativemaresbegantobecrossbredwith importedArabianstallions[18].TheEgyptianNativehorsesare referredasBaladihorses.AccordingtoMason[26],theEgyptian horse is a light riding animal of the Arab type found in Egypt. Microsatellites are currently the most commonly used markers for diversity studies in livestock. They have at their core a short DNA sequence of between two and ten base pair repeats which are variable in number and thus in length. The number of length polymorphisms of a microsatellite is equiva- lent to the number of its alleles. Most microsatellites are multiallelic. Microsatellites were first characterized in Swedish horse breed by Ellegren et al. [12] and Marklund et al. [25]. To our best knowledge, there are no previous studies on microsatellites polymorphism in horses raised in Egypt espe- cially Native breed. The present study was carried out for iden- tifyingthemicrosatellitepolymorphismsinthreedifferenthorse breeds raised in Egypt (Arabian, Thoroughbred horse and Native Egyptian horse), identifying the genetic relationship within and between these three breeds, inbreeding measure- ments,determiningthepurityofthesebreeds,finallycalculating the genetic distance and drawing the phylogenic tree. 2.1. Statistical analysis of the results POPGENE software package [41] was used to calculate allele frequencies, observed number of alleles, effective number of al- leles [22], observed (Ho) and expected (He) heterozygosity at each microsatellite in the five populations under study. Poly- morphism information content (PIC) value for each microsat- ellite was calculated by using the method described by Bostein et al. [4]. Pair-wise alleles sharing were calculated manually from the raw results. Using the variance-base method of Weir and Cockerham [38], population differentiation by F-statistics was computed using FSTAT version 2.9.3.2 computer pro- gram [17]. Mean a standard deviations of the F statistics pro- gram, F .f, that are analog to Wright’s [39,40] Fis and Fst, were obtained across breeds by the Jackknifing procedure over loci [37].The extent of global inbreeding was further studied with the same software by estimated Fis value. 2. Materials and methods Blood samples were collected in from a total of 43 animals rep- resenting three horse breeds {13 samples from Arabian breed (El-Zahra Station), 10 samples from Thoroughbred (El-Jezirah club) and 20 samples from Native Egyptian breed (Nazlet El-Seman)}. The blood collection tube contained EDTA as an anticoagulant matter [33]. Blood samples were collected from a total of 43 animals representing three horse breeds {13 samples from Arabian breed (El-Zahra Station), 10 samples from Thoroughbred Table 1 Microsatellite names, primer sequence information. microsatellite Primer sequence Chromosomal localization Allelic range References HTG10 CAATTCCCGCCCCACCCCCGGCA TTTTTATTCTGATCTGTCACATTT AACCCCTGAGCAAGGAAGT GCTCCCAGAGAGTTTACCCT CCACTAAGTGTCGTTTCAGAAGG CA CAACTGAGTTCTCTGATAGG AGCTGCCTCGTTAATTCA CTCATGTCCGCTTGTCTC GCAAGGATGAAGAGGGCAGC CTGGTGGGTTAGATGAGAAGTC 21 83–110 Marklund et al. [25] Binns et al. [2] Breen et al. [5] Eggleston-Stott et al. [11] Irvin et al. [19] AHT4 8 140–166 ABS2 15 237–268 CA425 28 224–247 ABS23 3 176–212
Genetic variations in horse using microsatellite markers 105 The effect of migration and gene flow on the genetic struc- ture of the analyzed populations was estimated between each pair of populations according to an island model under neu- trality and negligible mutation [35]. Genetic distances among populations were estimated using (Ds) standard genetic dis- tance of [30] and the DA distance of [31]. alleles (3.82), while Thoroughbred breed has (4.85) mean of effective number of alleles (Table 2). The values of Polymorphism Information Content (PIC) obtained from the present study varied from 0.864 (HTG10) in Egyptian Native breed to 0.525 (ABS23) in Arabian breed. Since the PIC values in the breeds under study were generally high, so that they could be employed for more utility in more biodiversity studies in these horse breeds (Table 2). Results of inbreeding within the breeds under study for the different microsatellites are presented at Table 3. Looking at the table in general, it is noticed that all the inbreeding values were negative and below zero. These values according to ani- mal breeders should be considered zero, meaning the complete absence of inbreeding within the same breeds under study. From estimation of genetic diversity (Shannon information in- dex) for each marker in each breed (Fig. 6) and for all breeds for five markers (Fig. 7), it was found that the highest genetic diversity was in Native horses (2.256) for the microsatellite HTG10, in Thoroughbred horse (1.917) for the microsatellite ABS2 and in Arabian horse (1.702) for the microsatellite AHT4. (Table 4) Genetic distance matrix declared that the highest genetic distance was found between Thoroughbred and Native breeds (0.4405). The lowest value for genetic distance was found between Native and Arabian (0.2586) (Table 5). High values 3. Results In the present study five equine microsatellites markers: AHT4, HTG10, ABS2, ABS23 and CA245, were analyzed in three different breeds of horse found in Egypt (Arabian, Thor- oughbred and Egyptian Native horse breeds). Out of the five microsatellites studied three of them proved to be highly poly- morphic. These were HTG10 (13 alleles), ABS2 (11 alleles) and AHT4 (10 alleles), the fourth and fifth markers, ABS23 and CA245 gave eight alleles each and these alleles were found to be present or shared by all breeds studied (Figs. 1–5). There- fore, these markers could be fruitfully used in paternity tests. The lowest mean excepted heterozygosity was 0.754 in the Arabian horse breed, while the highest mean was observed for the Thoroughbred horse 0.829 (Table 2). Native breed has the highest mean of effective number of alleles (5.7) and Arabian breed has the lowest mean of effective number of Figure 1 AHT4 in the studied breeds. Alleles and allele’s frequencies for the microsatellite Figure 3 ABS2 in the studied breeds. Alleles and allele’s frequencies for the microsatellite Figure 2 HTG10 in the studied breeds. Alleles and allele’s frequencies for the microsatellite Figure 4 ABS23 in the studied breeds. Alleles and allele’s frequencies for the microsatellite
106 K.F. Mahrous et al. polymorphism for this microsatellite was high in the Native breed, since nine out of its 10 alleles were identified. This is fol- lowed by the Arabian breed where six out of the 10 alleles were found. The thoroughbred horses exhibited the lowest polymor- phism for this microsatellite, only four out of the 10 alleles were detected. The range of allele sizes ranged from 142 to 160 bp. The present findings differ slightly from those observed by Meriaux et al. [27] who detected seven alleles in Arabian horses raised in France and Morocco, while Georgescu et al. [16] detected eight alleles in Arabian with size range of 144 to 162 bp. Regarding Thoroughbred horses, our results are in agreement with those reported by Tozaki et al. [36] since four alleles were detected for this microsatellite in European Thoroughbred horse. Moreover Seyedabadi et al. [34] detected four alleles in Iranian Caspian horses with size range of 164 to 171 bp. On the other hand Meriaux et al. [27] observed six al- leles in Thoroughbred horse, while Lee and Cho [23] detected five alleles in Thoroughbred horse raised in Korea. Georgescu et al. [16] detected six alleles in Thoroughbred horse raised in Romania with size range of 144–160 bp. The microsatellite (HTG10) gave the highest polymorphic one in all studied breed, since the total number of its alleles was 13. As in the microsatellite AHT4, still the Egyptian Na- tive is the highest polymorphic breed because 11 out of the 13 alleles of HTG10 were found, eight alleles were detected in Thoroughbred while in Arabian horse seven alleles were found for the marker HTG10. The range of allele sizes was from 80 to 106 bp. Regarding our results, the Thoroughbred exhibited total allele number similar to that reported by Lee and Cho [23]. They detected eight alleles in Thoroughbred horse raised in Korea. On the other hand, Tozaki et al. [36] Figure 5 CA245 in the studied breeds. Alleles and allele’s frequencies for the microsatellite for genetic identity means low values for genetic distance and vice versa. Finally the genetic relationship dendrogram (Fig 8) showed that the Arabian and the Native horses were aroused for com- mon ancestor (the same cluster) while the Thoroughbred came from another ancestor or cluster. 4. Discussion To the best of our knowledge this is the first study dealt with genetic variations in Egyptian Native horses using microsatel- lite markers. The microsatellite (AHT4) gave ten alleles as a to- tal number of alleles in the three horse breeds studied. The Table 2 expected) and polymorphism information content (PIC) at each microsatellite in the breeds under study. Microsatellite alleles (No, observed number of alleles; Ne, effective number of alleles), heterozygosity (Ho, observed; He, Breed Microsatellite AHT4 HTG10 ABS2 ABS23 CA245 Mean Native Alleles No Ne Ho He 9 6.106 0.950 0.857 0.816 4 3.636 0.700 0.763 0.674 6 5.045 0.923 0.833 0.774 12 8.080 1.0 0.898 0.864 8 5.128 1.0 0.847 0.779 7 3.976 1.0 0.778 0.719 10 7.619 0.700 0.891 0.854 8 6.060 1.0 0.879 0.814 5 4.235 1.0 0.833 0.725 6 4.819 0.600 0.812 0.762 6 4.444 1.0 0.816 0.741 6 2.209 0.538 0.569 0.525 5 2.285 0.450 0.579 0.524 7 5.000 0.700 0.842 0.771 6 3.674 0.615 0.757 0.689 8.4 5.7 0.740 0.807 0.764 6.600 4.853 0.880 0.829 0.750 6.000 3.828 0.815 0.754 0.686 Het. PIC Alleles Thoroughbred No Ne Ho He Het. PIC Alleles Arabian No Ne Ho He PIC Table 3 Inbreeding estimates (Fis) within breeds and for all loci in all breeds under study. Gene flow (Nm). Breed Microsatellite Total AHT4 ?0.136 0.035 ?0.151 0.053 HTG10 ?0.141 ?0.242 ?0.336 0.038 ABS2 0.194 ?0.197 ?0.309 0.051 ABS23 0.243 ?0.290 0.016 0.098 CA245 0.200 0.125 0.155 0.048 Fis/breed 0.060 ?0.117 ?0.136 – Native Thoroughbred Arabian Fst
Genetic variations in horse using microsatellite markers 107 Figure 8 the different horse breeds. Dendrogram showing the genetic relationship among The microsatellite (HTG10) gave the highest polymorphic one in all studied breed, since the total number of its alleles was 13. As in the microsatellite AHT4, still the Egyptian Na- tive is the highest polymorphic breed because 11 out of the 13 alleles of HTG10 were found, eight alleles were detected in Thoroughbred while in Arabian horse seven alleles were found for the marker HTG10. The range of allele sizes was from 80 to 106 bp. Regarding our results, the Thoroughbred exhibited total allele number similar to that reported by Lee and Cho [23]. They detected eight alleles in Thoroughbred horse raised in Korea. On the other hand, Tozaki et al. [36] found six alleles in European Thoroughbred. Whereas Georgescu et al. [16] detected 12 alleles with size range of 86 to 110 bp in Thoroughbred horse raised in Romania. With regard to Arabian horse the present findings differ from those reported by Georgescu et al. [16] who detected 11 alleles with size range of 82 to 110 bp for the microsatel- lite HTG10. Genotype analysis of the all markers showed significant deviation from HWE, this deviation was expected since we choose unrelated animals for analysis. Hardy–Weinberg dis- equilibrium indicates the presence of genetic diversity among and between horse breeds as well as the in balance of the breeds [10]. The Egyptian Native breed has more genotypes then Thor- oughbred and the last Arabian breed. This is due to the ab- sence of selection at all in Egyptian Native horses. In the microsatellite AHT4, the minimum polymorphism was found in Thoroughbred, while it was in Arabian and Thoroughbred in the microsatellites HTG10 and ABS23. Microsatellite CA245 showed minimum polymorphism in the Egyptian Native breed and all three horse breeds were similar in the ABS23 marker. Decreased number of alleles in AHT4, HTG10 and ABS2 markers for Arabian and Thoroughbred breeds may be due to the presence of genetic drift between these two breeds [13]. The high values of expected heterozygosity indicate that population has retained the presence of several alleles [29] and that was the situation that observed in the breeds understudy. Overall results showed that observed heterozygosity (Ho) was significantly different from expected heterozygosity (He) in all horse breeds for the five microsatellite loci. These find- ings are in agreement with those of Lee and Cho [23]. The high value for the Ho was expected due to the absence of Hardy Weinberg equilibrium in the breeds under study. High values of polymorphism information content (PIC) could be attributed to the large number of alleles or heterozy- gosity [21]. The mean values of PIC obtained from the present study ranged from 0.686 to 0.764.The values of PIC and genet- ic diversity were the highest in the Egyptian Native breed fol- lowed by Thoroughbred then Arabian breed. This indicates that The Egyptian Native breed has more heterozygosity, then Figure 6 Genetic diversity for each marker in each breed. 2.5 2 Genetic diveristy values 1.5 1 0.5 0 AHT4 HTG10 ABS2 ABS23 CA245 Figure 7 Genetic diversity for all breeds for five markers. Table 4 Gene flow (Nm) for all breeds in each microsatellite. Microsatellite Gene flow (Nm) AHT4 4.39 HTG10 6.30 ABS2 4.63 ABS23 4.90 CA245 2.30 Table 5 all loci and all breeds . Nei’s genetic identity (above diagonal) and genetic distance (below diagonal). Genetic Identity and Genetic Distance (Nei 1972) for Breed Arabian Thoroughbred Native Arabian Thoroughbred Native – 0.3461 0.2586 0.7075 – 0.4405 0.7721 0.6437 – found six alleles in European Thoroughbred. Whereas George- scu et al. [16] detected 12 alleles with size range of 86 to 110 bp in Thoroughbred horse raised in Romania. With regard to Arabian horse the present findings differ from those reported by Georgescu et al. [16] who detected 11 alleles with size range of 82 to 110 bp for the microsatellite HTG10.
108 K.F. Mahrous et al. Thoroughbred and finally the Arabian breed. The mean value of PIC in Thoroughbred horses in Slovakia was 0.817 [20] and in Thoroughbred horse in Korea was 0.652 [23]. It differs from that of Thoroughbred horse in this study. In the present study, all Fis values were below zero or were negative, which indicates the absence of inbreeding, or in other words that all individu- als were completely outbred. These results confirm heterozy- gosity test and denote that, there is a polymorphism between the individuals within a breed, and deviation from HWE. In AHT4, HTG10, ABS2 and CA245 markers, the lowest Fis va- lue was found in Arabian breed while the highest value was present in The Egyptian Native breed. So, Arabian is higher than The Egyptian Native for outbred. On the other hand, the highest outbred was shown in Thoroughbred breed and the lowest outbred was found in The Egyptian Native breed for ABS23 marker. In general, the present data showed that the Arabian breed is more outbreed then Thoroughbred and lastly the Egyptian Native breed. Regarding the Shannon information index (I), the highest genetic diversity detected was for the microsatellite ABS2 (2.232), followed by microsatellites HTG10 (2.154), AHT4 (1.978), ABS23 (1.708) and CA245 (1.532). This indi- cates that all microsatellites showed high genetic diversity among all breeds. The highest polymorphic breed was The Egyptian Native (1.826) and the lowest one was Arabian (1.505). The values of Fst (the proportion of total variation that is due to differences between populations) indicate moderate ge- netic differentiation [40]. In this study the range of Fst values was between 0.038 and 0.098 which indicates moderate genetic diversity among the three horse breeds. In this study Fst value may indicate the presence of gene flow between horse breeds. The highest gene flow between breeds was found in the marker HTG10 (6.30), while the lowest gene flow was shown in the marker ABS23 (2.30) Intermediate levels of gene flow may be due to absence of homozygosity. On the other hand, the presence of gene flow between these breeds may be due to their common origin [3,7]. Genetic distance matrix declared that the Egyptian Native horses and the Arabian ones have a common ancestor, while the divergence of Thoroughbred horses was not clear. This may be attributed to the low number of animals and of micro- satellites studied. This result could be logic due to raising of both the Arabian and Egyptian Native horses in near or close areas while Thoroughbred are so far geographically (England) from the Arabian region [32]. The large genetic distance between the Native Egyptian and Arabian from one side and Thoroughbred from the other side could be explained by restricted genetic variation due to the limited number of horses (limited stock of founders) involved in producing the Thoroughbred [8]. However, genetic drift and founder effects could not be responsible for these large ge- netic distances. In conclusion the results of the present study are a new proof for the possibility of using microsatellite in diversity studies. In general diversity studies provide information on variation between and within breeds at the DNA level. From our findings it was possible to have a good idea about the ge- netic diversity and correlation between the three breeds understudy. References [1] K.A. Aberle, O. Distl, Arch. Tierz. Dummerstorf. 47 (6) (2004) 517–535. [2] M.M. Binns, N.G. Holmes, A. Holliman, A.M. Scott, Br. Vet. J. 151 (1) (1995) 9–15. [3] G. Bjørnstad, K.H. Røed, Anim. Genet. 32 (2) (2003) 59–65. [4] D. Botstein, R.L. White, M. Skolnick, R.W. Davis, Am. J. Hum. Genet. 32 (1980) 314–331. [5] M.Breen,G.Lindgren,M.M.Binns,J.Norman,Z.Irvin,K.Bell, K. Sandgerg, H. Ellegren, Mamm. Genome 8 (1997) 267–273. [6] S. Budiansky, The Horse, Microsoft ? Encarta ? Encyclopedia, 2004. [7] J. Can ˜ on, M.L. Checa, C. Carleos, J.L. Vega-Pla, M. Vallejo, S. Dunner, Anim. Genet. 31 (1) (2000) 39–48. [8] P. Cunningham, Sci. Am. 264 (1991) 92–98. [9] M. Derry, Horses in Society: A Story of Animal Breeding and Marketing, University of Toronto Press, Toronto, 2006 (pp. 1800–1920). [10] Eding H., Meuwissen T.H.E., 2002. The use of marker estimated kinship to measure genetic diversity. In: Proceedings of the 7th World Congress on Genetics Applied to Livestock Production, pp. 19–23. [11] M. Eggleston-Stott, L.A. DelValle, M. Bautista, D. Dileanis, E. Wictum, A.T. Bowling, Anim. Genet. 28 (1997) 370–371. [12] H. Ellegren, M. Johansson, K. Sandebrg, L. Andersson, Anim. Genet. 23 (1992) 133–142. [13] D.S. Falconer, Introduction to Quantitative Genetics, Third ed., Longmann, London, 1989. [14] FAO, 1995. In: Beate D. Scherf (Ed.), World Watch List for Domestic Animal Diversity, second ed. FAO, Rome, Italy. [15] FAOSecondary Guidelines for Development of National Farm Animal Genetic Resources Management Plans. Measurement of Domestic Animal Diversity (Mo-DAD): Original Working Group Report, Food and Agriculture Organization of the United Nations, Rome, 1998 (<http://dad.fao.org/en/refer/ library/guidelin/workgrp.pdf>). [16] Georgescu S., Condac E., Rebedea M., DumitruTesio C., Dinischiotu, A., Marieta C., 2008. Arabian horses genotyping using seventeen microsatellites. In: Proceedings of the Balkan scientific conference of biology, pp. 202–209. [17] J. Goudet, FSTAT Computer Package for PCs, Institute of Ecology, UNIL, Lausanne, Switzerland, 2002. [18] E.W. Hill, D.G. Bradley, M. Al-barody, O. Ertugrul, R.K. Splan, I. Zakharov, E.P. Cunningham, Anim. Genet. 33 (2002) 287–294. [19] Z. Irvin, J. Giffard, R. Brandon, M. Breen, K. Bell, Anim. Genet. 29 (1998) 67. [20] D. Jakabova, J. Trandzik, J. Chrastina, Lˇ. Hudecova, E. Zetochova, J. Bulla, A. Bugarsky, F. Jakab, P. Kozila, Czech J. Anim. Sci. 47 (12) (2002) 497–501. [21] S.T. Kalinowski, Heredity 88 (2002) 62–65. [22] M. Kimura, J.F. Crow, Genetics 68 (1964) 47. [23] S.Y. Lee, G.J. Cho, J. Vet. Sci. 7 (1) (2006) 63–67. [24] M.A. Levine, Domestication and early history of the horse, in: D.S. Mills, S.M. McDonnell (Eds.), The Domestic Horse: The Origins, Development, and Management of its Behavior, Cambridge University Press, 2005. [25] S. Marklund, H. Ellegren, S. Eriksson, K. Sandberg, L. Andersson, Anim. Genet. 25 (1994) 19–23. [26] I.L. Mason, A World Dictionary of Livestock Breeds, Types and Varieties, fourth ed., C.A.B International, 1996 (p. 273). [27] J.C. Meriaux, X. Rognon, R. Mahla, L. Ouragh, M.Y. Boscher, Usefulness of Microsatellite Markers for Parentage Control and Phylogenetic Relationships in France and Moroccan Horse Breeds, Poster presented in international conference on animal genetics, Auckland, New Zealand, 1998.
Genetic variations in horse using microsatellite markers 109 [28] S.A. Miller, D.D. Dykes, H.F. Polesky, Nucl. Acids Res. 16 (1988) 12–15. [29] B. Moioli, A. Georgoudis, F. Napolitano, G. Catillo, E. Giubilei, Ch. Ligda, M. Hassanane, Livestock Prod. Sci. 7 (3) (2001) 203–211. [30] M. Nei, Am. Nat. 106 (1972) 283–292. [31] M. Nei, F. Tajima, Y. Tateno, J. Mol. Evol. 19 (1983) 153–170. [32] N. Saitou, M. Nei, Mol. Biol. Evol. 4 (4) (1987) 406–425. [33] J. Sambrook, E.F. Fritsch, T. Maniatis, Molecular Cloning – A Laboratory Manual, Cold Spring Harbor Laboratory Press, 1989. [34] H. Seyedabadi, C. Amirinia, M.H. Banabazi, H. Emrani, Iran. J. Biotech. 4 (4) (2006). [35] M. Slatkin, Annu. Rev. Ecol. Syst. 16 (1985) 393–430. [36] T. Tozaki, H. Kakoi, S. Mashima, K. Hirota, T. Hasegawa, N. Ishida, N. Miura, N.H. Choi-Miura, M. Tomita, J. Vet. Med. Sci. 63 (11) (2003) 1191–1197. [37] B.S. Weir, Genetic Data Analysis, Sinauer, Sunderland, MA, 1990. [38] B.S. Weir, C.C. Cockerham, Evolution 38 (1984) 1358–1370. [39] S. Wright, Ann. Eugen. 15 (1951) 323–354. [40] S. Wright, Evolution and the Genetics of Population: Variability Within and Among Natural Population, vol. 4, University of Chicago Press, Chicago, 1978, IL.. [41] F.C. Yeh, T. Boyle, Y. Rongcai, Z. Ye, J.M. Xian, POPGENE, Version 1.31: A Microsoft Window Based Free Ware for Population Genetic Analysis, Edmonton, 1999. University of Alberta,