Download

1 / 62
620 likes | 743 Vues
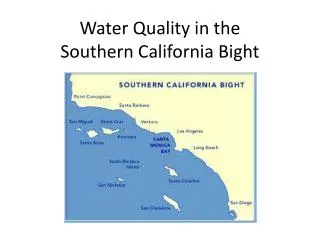
Bight 03 Water Quality. Plume Effects Chapter. Chapter Outline. Plume Effects: suspended load; nutrients; bacteria; toxicity Where do constituents go? Remote sensing Discrete -> Satellite data -> Salinity -> Estimates -> Management decisions (???)

E N D
Bight 03 Water Quality Plume Effects Chapter
Chapter Outline • Plume Effects: suspended load; nutrients; bacteria; toxicity • Where do constituents go? • Remote sensing • Discrete -> Satellite data -> Salinity -> Estimates -> Management decisions (???) • How many tons SiO4 enter system during storm? • Provide social and regulatory perspective • Link to other studies • What is their duration? • Bacteria well documented • Nutrients convert to phytoplankton = couple • Site specific investigations
Chapter Outline • Lessons learned • Self evaluation • What worked; what didn’t • Critique calculations used • Why was WQ good?
Santa Clara River (n = 271) San Diego River (n = 163) Storm Event 1 – Feb 24th to Mar 30th 2004 Temperature (Cº) • San Pedro (n = 3980) • Tijuana River (n = 672) • Ballona Creek (n = 666) • All Regions Combined (n = 6588)
Santa Clara River (n = 271) San Diego River (n = 163) Storm Event 1 – Feb 24th to Mar 30th 2004 Beam Attenuation (%) • San Pedro (n = 3980) • Tijuana River (n = 672) • Ballona Creek (n = 666) • All Regions Combined (n = 6588)
Santa Clara River (n = 271) San Diego River (n = 163) Storm Event 1 – Feb 24th to Mar 30th 2004 CDOM • San Pedro (n = 3980) • Tijuana River (n = 672) • Ballona Creek (n = 666) • All Regions Combined (n = 6588)
Santa Clara River (n = 271) San Diego River (n =163) Storm Event 1 – Feb 24th to Mar 30th 2004 Dissolved Oxygen (mg/L) • San Pedro (n = 3980) • Tijuana River (n = 672) • Ballona Creek (n = 666) • All Regions Combined (n = 6588)
Santa Clara River (n = 271) San Diego River (n = 163) Storm Event 1 – Feb 24th to Mar 30th 2004 Chla (ug/L) WET • San Pedro (n = 3980) • Tijuana River (n = 672) • Ballona Creek (n = 666) • All Regions Combined (n = 6588)
Santa Clara River (n = 18) San Diego River (n = 12) Storm Event 1 – Feb 24th to Mar 30th 2004 Chla (ug/L) Discrete • San Pedro (n = 186) • Tijuana River (n = 53) • Ballona Creek (n = 52) • All Regions Combined (n = 321)
San Pedro Shelf – Storm 1, Chla Discrete vs Salinty (ppt) & Depth (m)
Storm Event 1 – Feb 24th to Mar 30th 2004 NO2 (uM) Santa Clara River (n = 18) San Diego River (n = 12) • San Pedro (n = 186) • Tijuana River (n = 53) • Ballona Creek (n = 52) • All Regions Combined (321)
Santa Clara River (n = 18) San Diego River (n = 12) Storm Event 1 – Feb 24th to Mar 30th 2004 NO3 (uM) • San Pedro (n = 186) • Tijuana River (n = 53) • Ballona Creek (n = 52) • All Regions Combined (321)
Santa Clara River (n = 18) San Diego River (n = 12) Storm Event 1 – Feb 24th to Mar 30th 2004 PO4 (uM) • San Pedro (n = 186) • Tijuana River (n = 53) • Ballona Creek (n = 52) • All Regions Combined (n = 321)
Santa Clara River (n = 18) San Diego River (n = 12) Storm Event 1 – Feb 24th to Mar 30th 2004 SiO4 (uM) • San Pedro (n = 186) • Tijuana River (n = 53) • Ballona Creek (n = 52) • All Regions Combined (n = 321)
Santa Clara River (n = 18) San Diego River (n = 12) Storm Event 1 – Feb 24th to Mar 30th 2004 TSS (mg/L) • San Pedro (n = 186) • Tijuana River (n = 53) • Ballona Creek (n = 52) • All Regions Combined (n = 321)